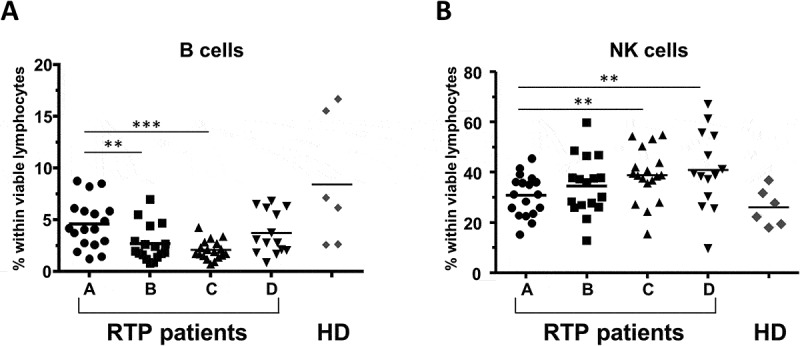
Figure 3.

Impact of RT on B cells and NK cells. Percentage of (A) B lymphocytes, and (B) NK cells within viable lymphocytes for the 4 timepoints A-D; n = 18 RT patients are included. Healthy donors are shown in comparison (n = 6, mean of three timepoints per donor). Bars indicate means. Significant differences: ** p < 0.01; *** p < 0.001.
