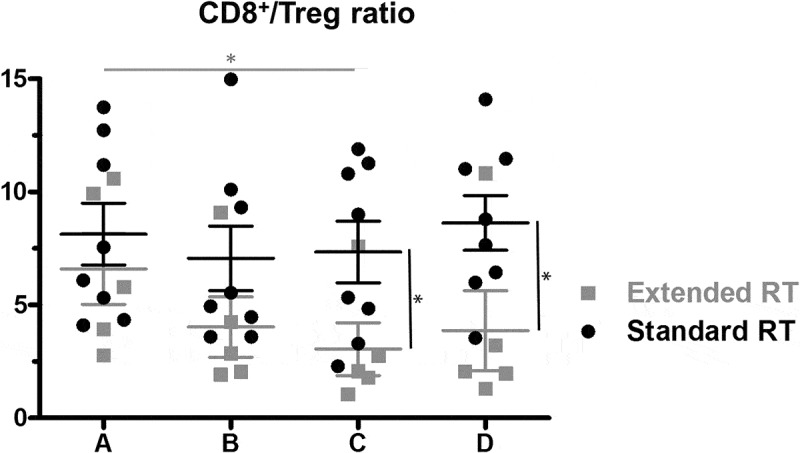
Figure 6.

The ratio of CD8+ T cells to Tregs within CD4+ cells at the four timepoints for patients receiving standard (n = 8) vs extended (n = 5) RT. Mean and SEM are shown. Significant differences were detectable in the group treated with extended RT volumes at timepoint C compared to initial CD8+/Treg ratio, as well as between the treatment groups at timepoints C and D. * p < 0.05.
