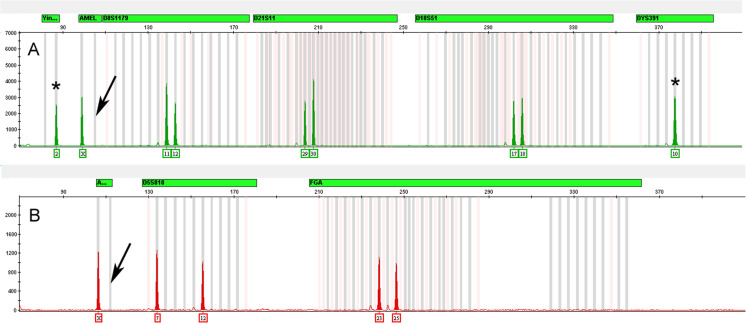
Fig. 11.
Electropherograms of amplified DNA from an Amelogenin-Y null male. Panel a and b show the profiles from the Globlafiler and Identifiler Plus kits, respectively. Both profiles show the loss of the Amelogenin-Y allele as shown by the arrows. The asterisks correspond to the Yindel-2 and DYS391-10 alleles in the Globlafiler kit profile

