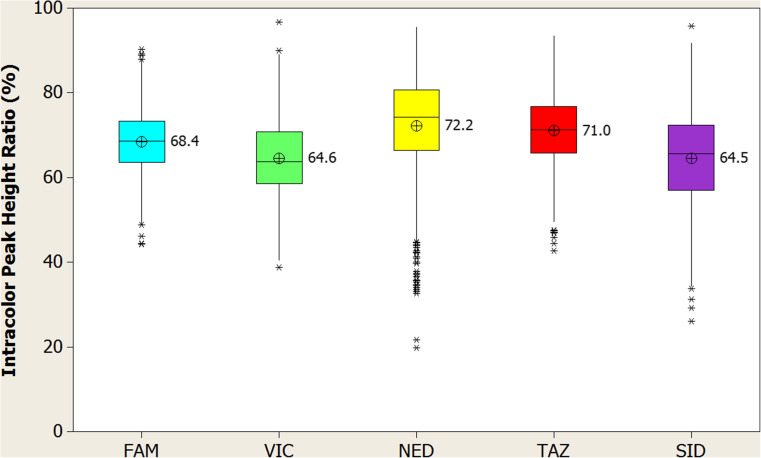
Fig. 12.
Intra-color peak height ratio analysis. Intra-color peak height ratio for each dye channel observed in population study (N = 817 individuals). Individual dye channels are indicated along the x-axis, with intra-color peak height ratios represented by corresponding box plots and mean indicator (circle with “x”) scaled to the y-axis. Each colored box represents the 25th through the 75th percentile of the observed values with the center line indicating the median. Whiskers indicate the range of the observed data, with points that are different than the mean by more than twice the pooled standard deviation shown as asterisks

