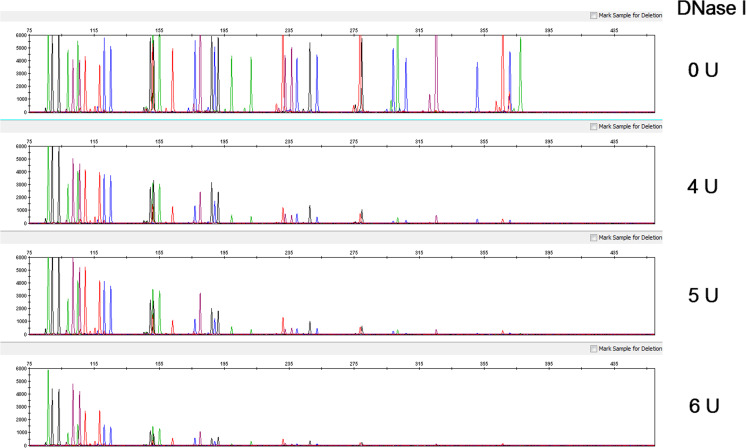
Fig. 8.
Degraded DNA study electropherograms. Representative profiles from GlobalFiler™ reactions using 1.0 ng of control genomic DNA (Raji) that had been subjected to controlled degradation. Collectively, the profiles show a trend of diminished recovery of larger alleles with increasing levels of degradation. Y-axis scale equals 6000 RFU

