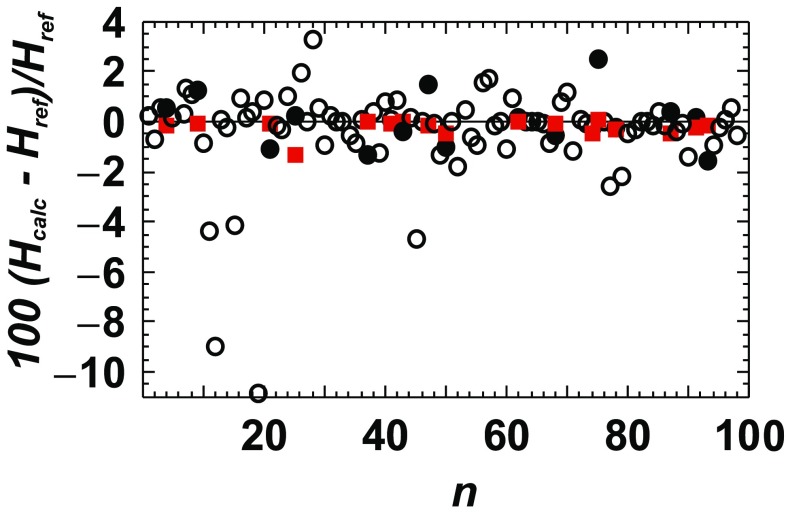
Fig. 6.
DFT versus estimation method of van Hinsburg et al. (2005). The relative deviation of the calculated standard enthalpy ((Hcalc−Href)/Href) from reference values (Holland and Powell 2011) are plotted for the minerals investigated in van Hinsburg et al. (2005). Squares represent the DFT data of this study, which are compared to the estimated values (filled circles). Open circles represent estimated values for minerals not investigated by the DFT method

