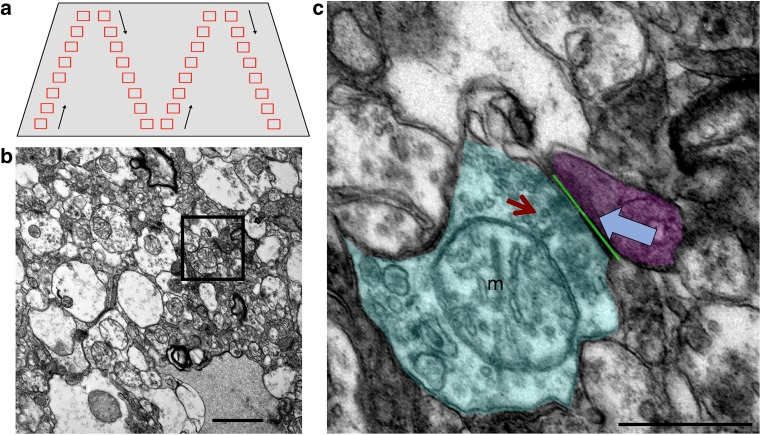
Fig. 1.
EM Sampling. TEM images were taken throughout the neuropil in a systematic fashion to ensure sampling from the entire tissue block face without repeated sampling or bias (a). Images were taken at ×6000 magnification (b). Individual synapses (inset in b, c) were identified by the presence of at least three presynaptic vesicles (red arrow) and a clearly identifiable, electron-dense post-synaptic density (blue arrow). The presence of mitochondria (m) in the pre- (shaded cyan) or post-(shaded magenta) synaptic terminals was recorded and the length of the PSD opposed to the presynaptic active zone was measured (green line). Scale bars represent 1 μm (b), 500 nm (c)

