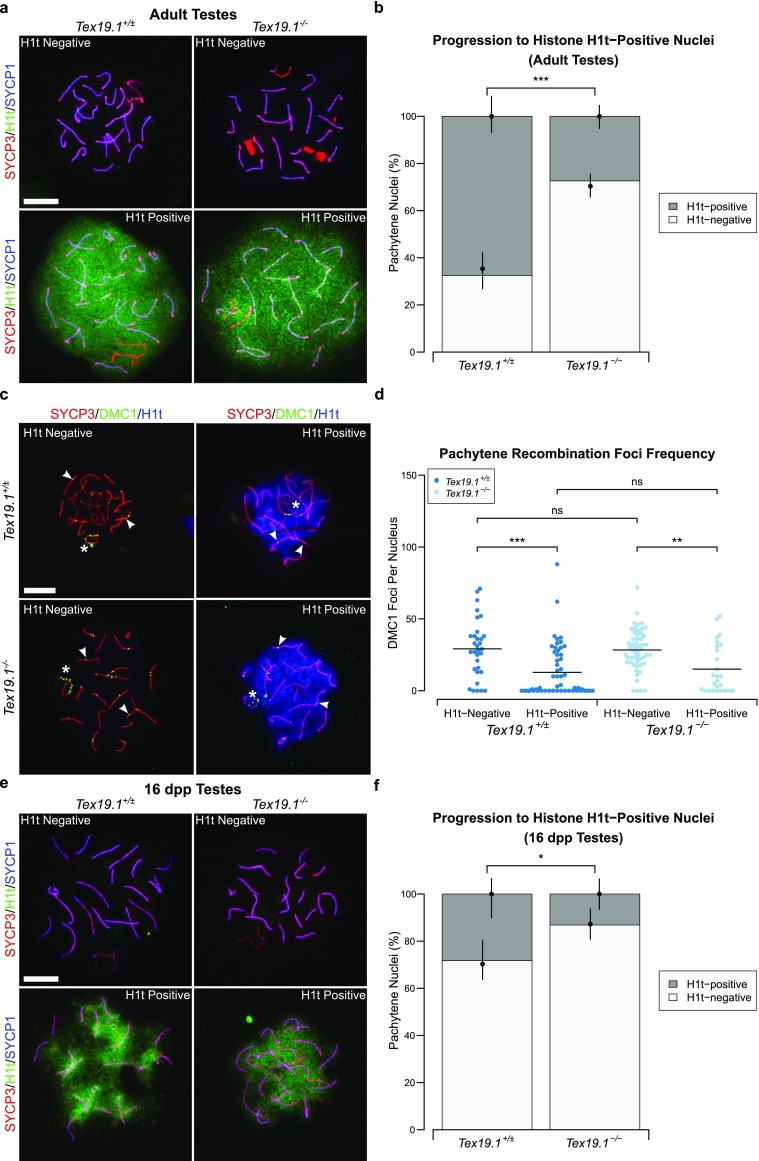
Fig. 3.

Expression of the mid/late pachytene marker histone H1t is delayed in autosomally synapsed pachytene Tex19.1−/− spermatocytes. a Immunostaining for histone H1t (green) in Tex19.1+/± and Tex19.1−/− autosomally synapsed pachytene spermatocyte chromosome spreads. Examples of histone H1t-positive and H1t-negative images are shown. SYCP3 (red) and SYCP1 (blue) mark the lateral elements and transverse filaments of the synaptonemal complex, respectively. Scale bars 10 μm. b Quantification of the proportions of autosomally synapsed pachytene nuclei that are H1t-positive; 67.6% of Tex19.1+/± and 27.4% of Tex19.1−/− pachytene nuclei (n = 111, 95; Fisher’s exact test, *** indicates p < 0.001) obtained from three animals of each genotype were H1t-positive. c Co-immunostaining for DMC1 (green) and histone H1t (blue) in Tex19.1+/± and Tex19.1−/− autosomally synapsed pachytene spermatocyte chromosome spreads. SYCP3 (red) marks the lateral elements of the synaptonemal complex. DMC1 foci co-localising with axes were scored as recombination foci. Asterisks indicate sex chromosomes, arrowheads indicate example recombination foci. Scale bar 10 μm. d Scatterplot showing the number of axial recombination foci in H1t-positive and H1t-negative autosomally synapsed pachytene nuclei from Tex19.1+/± and Tex19.1−/− testes. Means are indicated by horizontal lines. Mean foci frequencies are 29 ± 20, 13 ± 18, 28 ± 14 and 15 ± 17 from left to right across the plot. Numbers of nuclei analysed were 32, 55, 53 and 26 from a total of at least 3 experimental or 3 control animals. Foci counts were compared using a Mann-Whitney U test; asterisks denote significance (**p < 0.01, ***p < 0.001), ns indicates no significant difference (p > 0.05). e Immunostaining for histone H1t (green) in autosomally synapsed pachytene spermatocyte chromosome spreads from 16 dpp prepubertal Tex19.1+/± and Tex19.1−/− animals. Examples of histone H1t-positive and H1t-negative images are shown; SYCP3 (red) and SYCP1 (blue) mark the lateral elements and transverse filaments of the synaptonemal complex, respectively. Scale bars 10 μm. f Quantification of the proportions of autosomally synapsed pachytene nuclei at 16 dpp that are H1t-positive; 28.3% of Tex19.1+/± and 13.2% of Tex19.1−/− pachytene nuclei (n = 99, 76; Fisher’s exact test, * indicates p < 0.05) obtained from three animals of each genotype were H1t-positive
