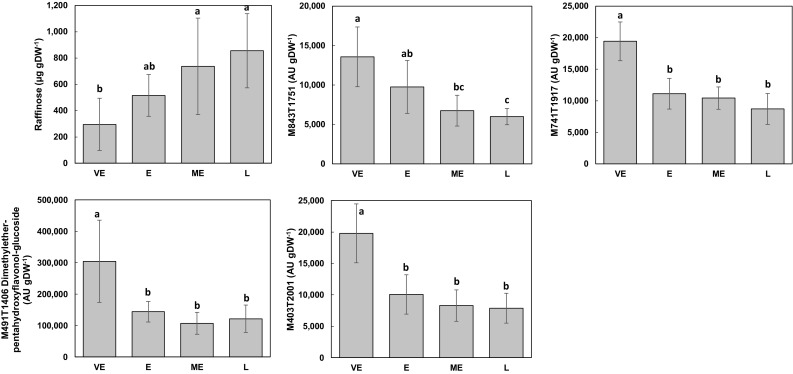
Fig. 4.

Mean contents for each silage-earliness group for the metabolites or metabolite features highlighted using VIP scores of OSC-OSC-PLS-DA of NS compositional data. VE very-early, E early, ME mid-early, L late, AU arbitrary units. Vertical bars represent standard deviations. For each variable, bars accompanied by the same letter are not significantly different according to Tukey’s test (P < 0.05)
