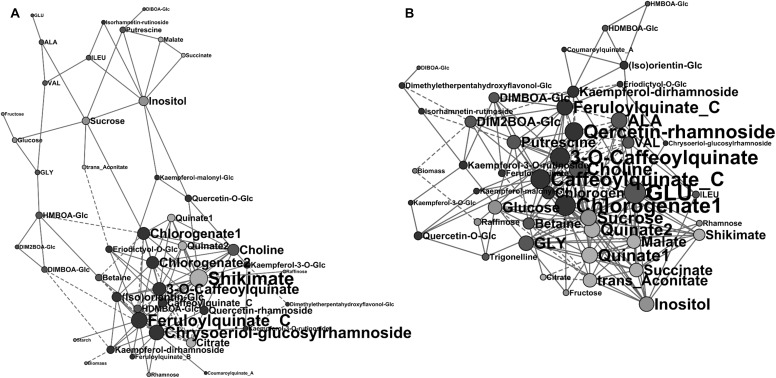
Fig. 5.
Networks of identified compounds and aerial biomass, based on correlations. Pearson correlations (after log2 transformation) in young leaf of maize hybrids cultivated in the field calculated with FDR correction (q < 0.02) and visualized using Cytoscape. Node size is proportional to the number of connections. Compound nodes are coloured according to the compound family: pink, sugars or sugar alcohols; green, organic acids; blue, amino acids and other amino compounds; purple, benzoxazinoids; brown, phenolic compounds. Biomass is coloured in red. Solid vertices, positive correlations; dashed vertices, negative correlations. a NS condition, 29 hybrids. b ES condition, 30 hybrids

