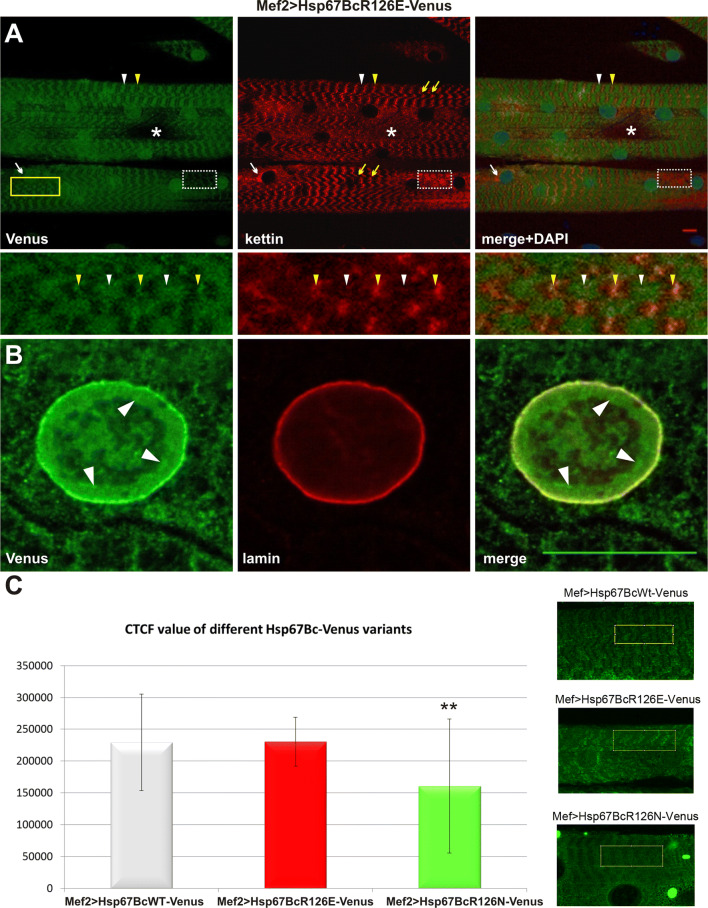
Fig. 3.
Phenotypic analysis of Mef2 > Hsp67BcR126E-Venus larval muscles. a Hsp67BcR126E-Venus displays accumulations along the muscle fibers retaining a striated sarcomeric pattern at the level of Z- (white arrowheads) and A-bands (yellow arrowheads). Note the presence of different local myofibrillar disruptions: Hsp67BcR126E-Venus perinuclear accumulation (white arrows), a significant reduction of Venus signal (dotted frame) accompanied by disturbances in kettin arrangement manifested by its local aggregation, complete loss of sarcomeric pattern (asterisks), and local misalignments of myofibrils (yellow arrows). Longitudinal optical sections of ventral longitudinal VL4. Anti-kettin (DSHB), DAPI. Scale bar: 10 μm. Inset: Magnification of region marked by yellow frame. Local misalignments of myofibrils. Hsp67BcR126E-Venus displays accumulations along the muscle fibers retaining a striated sarcomeric pattern at the level of Z- (white arrowheads) and A-bands (yellow arrowheads). b Translocation of a small fraction of the Hsp67BcR126E-Venus into the nucleus. The Hsp67BcR126E-Venus forms a relatively thick fraction in the proximity of the nuclear envelope (white arrowheads). Magnified longitudinal optical sections of ventral longitudinal VL4. Anti-LamC28.26 (DSHB), DAPI. Scale bar: 1 μm. c Evaluation of Venus-tagged Hsp67Bc variants’ expression levels in Mef2 > Hsp67BcWT-Venus, Mef2 > Hsp67BcR126E-Venus and Mef2 > Hsp67BcR126N-Venus ventral longitudinal VL4 muscles. The Image J based corrected total cell fluorescence (CTCF) method was applied for measurements of fluorescent signals. The cytoplasmic aggregates present in Mef2 > Hsp67BcR126N-Venus muscle were not quantified by the CTCF method. The Venus signal levels is comparable in Mef2 > Hsp67BcWT-Venus and Mef2 > Hsp67BcR126E-Venus muscles. The Venus signal in Mef2 > Hsp67BcR126N-Venus muscles is significantly lower in comparison with Mef2 > Hsp67BcWT-Venus. Error bars indicate SEM, n = 12 images per genotype; **P < 0.01 (Student’s t test). Inset: Exemplary confocal images of muscles expressing Venus-tagged Hsp67Bc variants with region marked by yellow frame used for signal measurements

