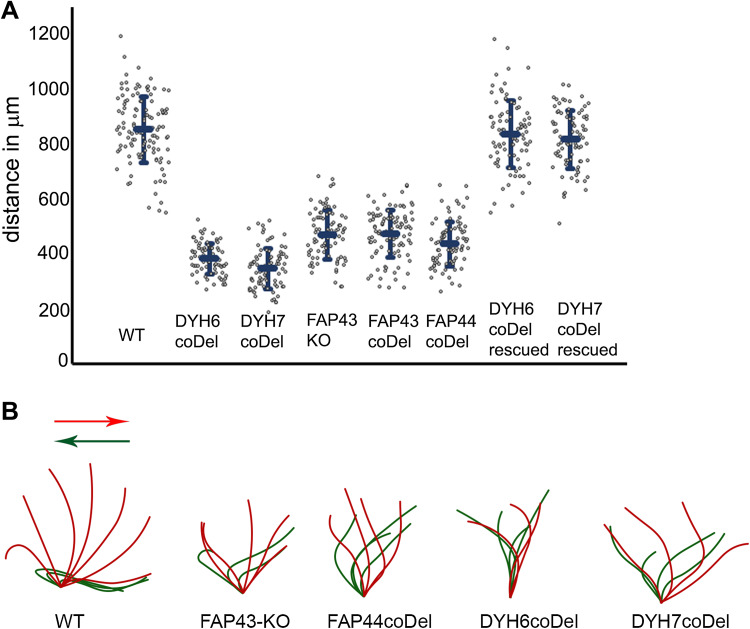
Fig. 2.
Comparison of the motility and ciliary waveform of wild-type and Tetrahymena mutants. a Graph representing distances with standard deviation swam during 3.2 s by wild-type (WT, 849 ± 120 μm, n = 117), DYH6coDel (381 ± 55 μm, n = 79), DYH7coDel (346 ± 73 μm, n = 89), FAP43-KO (469 ± 88 μm, n = 84), FAP43coDel (473 ± 84 μm, n = 100), FAP44coDel (435 ± 81 μm, n = 100), DYH6coDel rescued (833 ± 120 μm, n = 90), DYH7coDel rescued (814 ± 104 μm, n = 81). N number of measured paths. b Drawings representative of tracing of the power (red) and recovery (green) stroke of a single cilium: wild-type, FAP43-KO, FAP44 coDel, DYH6 coDel and DYH7 coDel. Drawings were prepared based on the images selected from high-speed videos (Fig. S5 and supplemental Movies)

