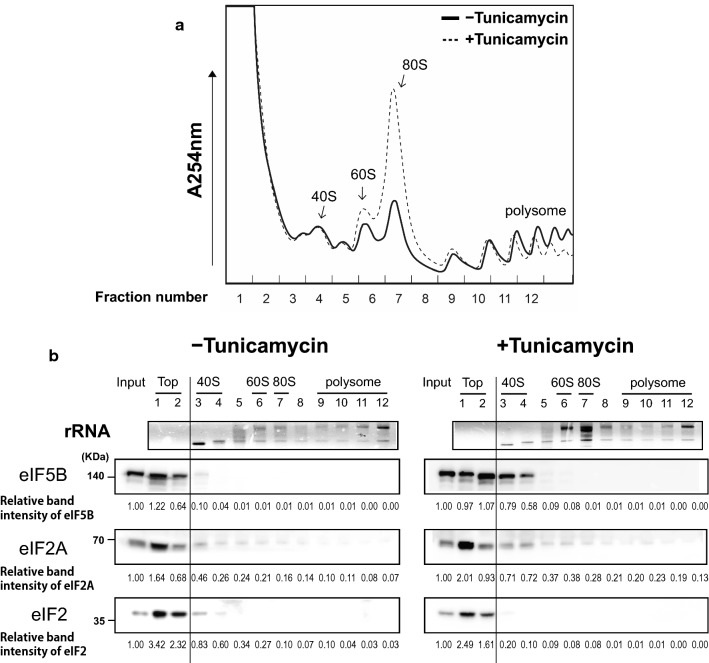
Fig. 5.
Both eIF2A and eIF5B are associated with 40S ribosome under stress conditions. Sucrose gradient analyses were performed with cell extracts from mock- or tunicamycin (2 μg/ml)-treated 293FT cells. Cell extracts were centrifuged on 5–45% sucrose gradients. a Ribosomal distributions were monitored by measuring absorbance at 254 nm. b Fractions of the sucrose gradients were collected, and every second fraction was used for the analyses of rRNAs and proteins. The RNAs in each selected fraction were resolved by agarose gel electrophoresis after phenol/chloroform extraction followed by ethanol precipitation, and rRNAs were visualized by ethidium bromide staining (panel rRNA). Proteins in each selected fraction were methanol-precipitated and analyzed by western blotting with antibodies against eIF5B (ProteinTech Group), eIF2A (ProteinTech Group), and the α subunit of eIF2 (Novus) (panels eIF5B, eIF2A and eIF2, respectively). The protein band intensities were quantified, and the relative values of the band intensity with respect to the same protein in the 10% of cell extract (Input) (which was set to 1) are depicted as numbers

