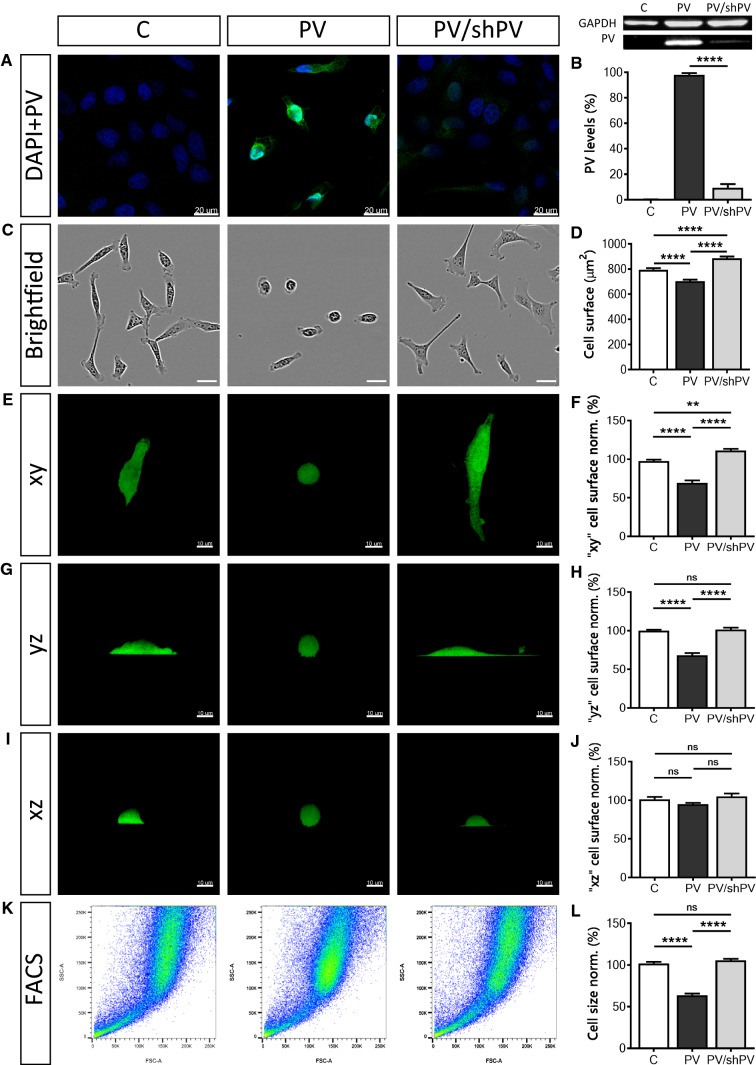
Fig. 1.
Parvalbumin overexpression decreases cell surface area and cell size. Detection of PV (green) and nuclear (blue) staining by immunocytochemistry (a). Signal for PV (green) was below the threshold for detection in control C-MDCK cells, yet nuclei were stained by DAPI (blue). Protein expression levels of PV in the three MDCK cell lines were determined also by Western blot analysis (b). For the normalization, GAPDH signals were used. Values were from three independent experiments. Representative images of MDCK cells acquired using the IncuCyte Live-Cell Imaging system (c). The surface area of more than 400 cells in each group was quantified (d). MDCK cells reconstructed in Imaris software were rotated to show their surface area at different angles—xy (e), yz (g) and xz (i) view. More than 200 cells were analyzed in each set (f, h, j). Representative graphs from flow cytometry analysis show forward scatter and side scatter (k) of 1 × 10⁶ MDCK cells. Analysis was done in FlowJo software and normalized to control cells (l)

