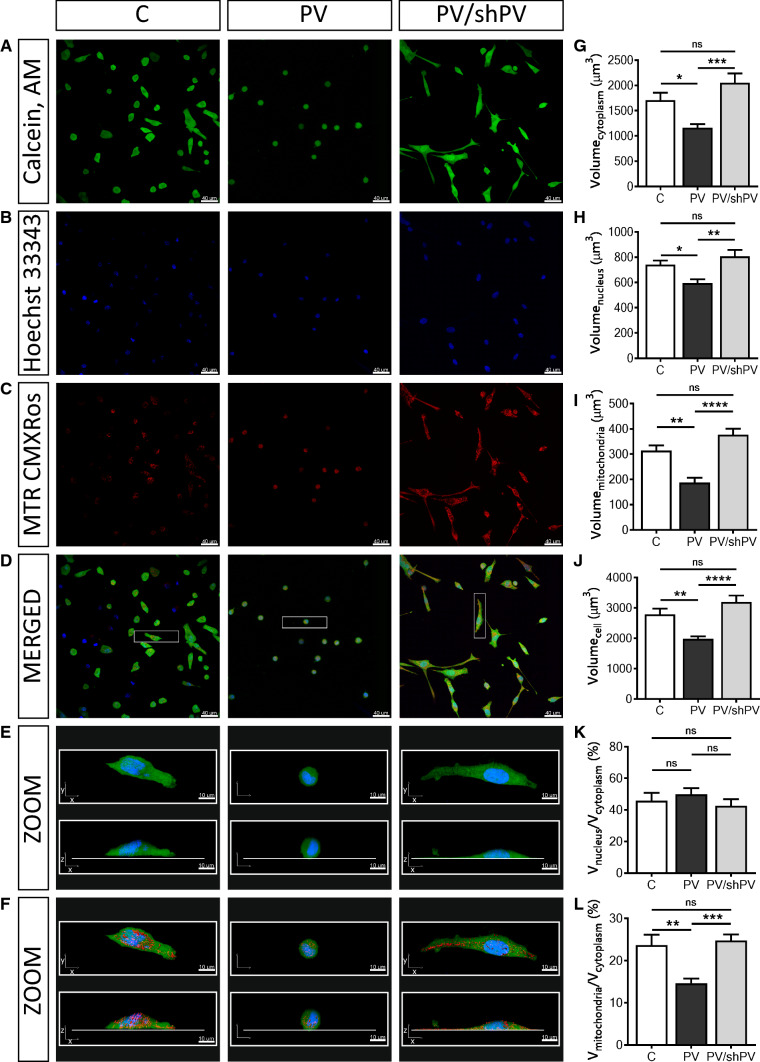
Fig. 2.
Parvalbumin decreases the whole-cell volume and the mitochondrial (absolute and relative) volume of MDCK cells. Representative confocal images showing the cytoplasm (a) in green (Calcein-AM), nuclei (b) in blue (Hoechst 33342), and mitochondria (c) in red (MitoTracker™ Red CMXRos). Selected representative cells (white rectangle) from merged images (d) are shown also at higher magnification (e) as xy- and xz-views of the same cells and in a 3D view with red-stained mitochondria also in xy- and xz-views (f). Individual cells were reconstructed in Imaris software analyzed in the “Cell mode” and “Surface mode”. More than 200 cells were analyzed per group from five independent experiments. Cells undergoing mitosis and cells at the edges of the microscope field of view were excluded from analysis. Stereological analysis of 3D-reconstructed MDCK cells revealed that the volume of the cytoplasm (g), nuclei (h), mitochondria (i) and of the whole cell (j) were significantly decreased in MDCK cells with ectopic expression of PV. There was also a significant decrease in the ratio of mitochondrial and cytoplasmic volumes (l) in the PV-overexpressing group, while the ratio of nuclei to cytoplasm (k) remained unchanged; see also supplementary movies showing representative MDCK cells

