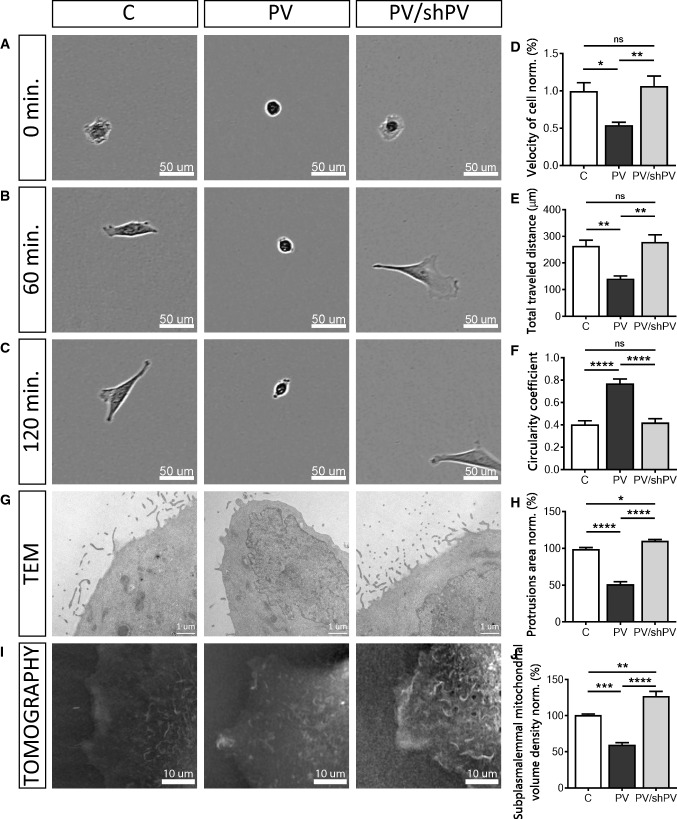
Fig. 3.
Parvalbumin decreases the cell motility. Brightfield images taken at 0 (a), 60 (b), and 120 min (c) after seeding of the three MDCK cell lines (C-MDCK, PV-MDCK, shPV/PV-MDCK). Measurements of relative velocity normalized to C-MDCK cells (d) and total distance travelled during 120 min (e). Evaluation of circularity coefficient of the MDCK cell lines. The quantification of at least 100 cells in each group is shown (f). Representative TEM images of protrusions (filopodia, lamellipodia) in MDCK cells (g) were taken at 24,500× magnification. The quantification of at least 15 cells in each group is shown (h). Representative images from tomography (i) showing mitochondria (light color) and plasma membrane based on the refraction index. Subplasmalemmal mitochondrial volume density normalized to C-MDCK cells was analyzed using STEVE software (j)

