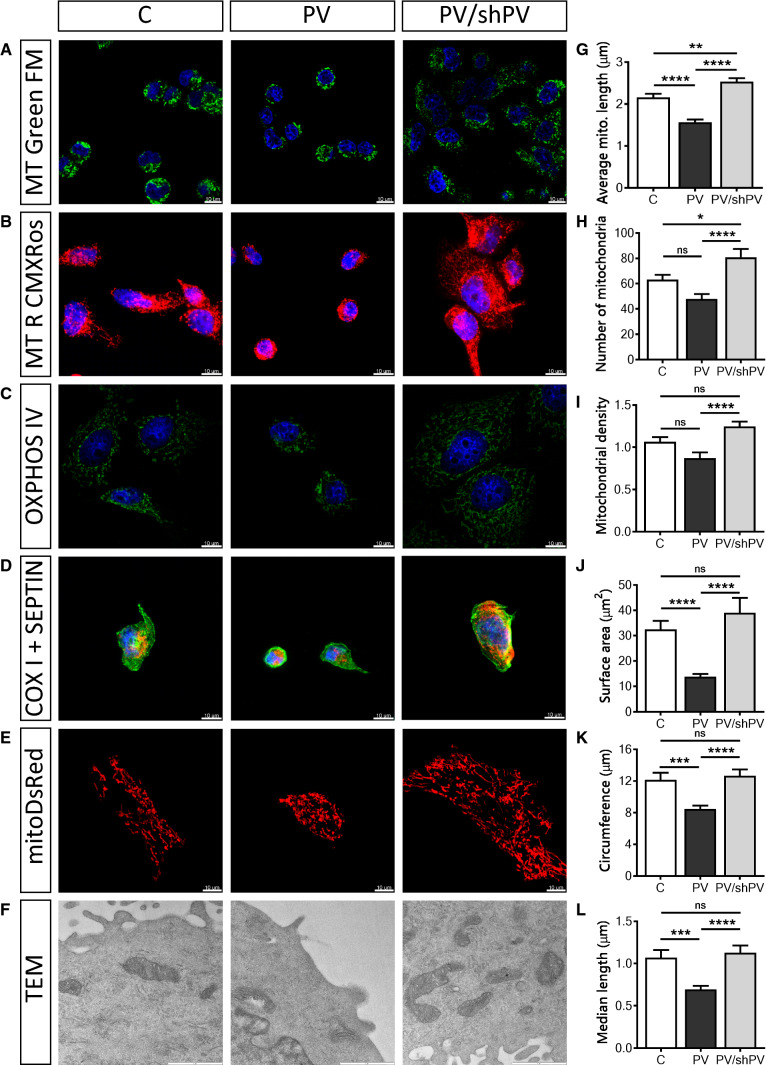
Fig. 4.
PV-overexpression decreases the length, surface area and density of mitochondria. Several fluorescent dyes, antibodies or fluorescent proteins were used to confirm the mitochondrial morphology and location within cells. Representative images show mitochondria visualized by MitoTracker™ Green (a) and MitoTracker™ Red CMXRos (b). Immunocytochemical staining using a primary antibody against oxphos IV (c) or against COX I (red) and septin 7 (green) (d) is shown. Nuclei were counterstained with DAPI (blue). MDCK cells were transfected with the mitochondria-targeted protein mitoDsRed (e) to quantify the mitochondrial length (g), number (h) and density of mitochondria (i). More than 1500 mitochondria were analyzed per group. Mitochondrial ultrastructure (f) was examined by transmission electron microscopy (TEM) at 33,000× magnification. Scale bar represents 1 µm. The mitochondrial size was determined by measuring the mitochondrial surface area (j), circumference (k) and median length (l) and from at least 30 cells per group with 100 individual mitochondria

