Fig. 5.
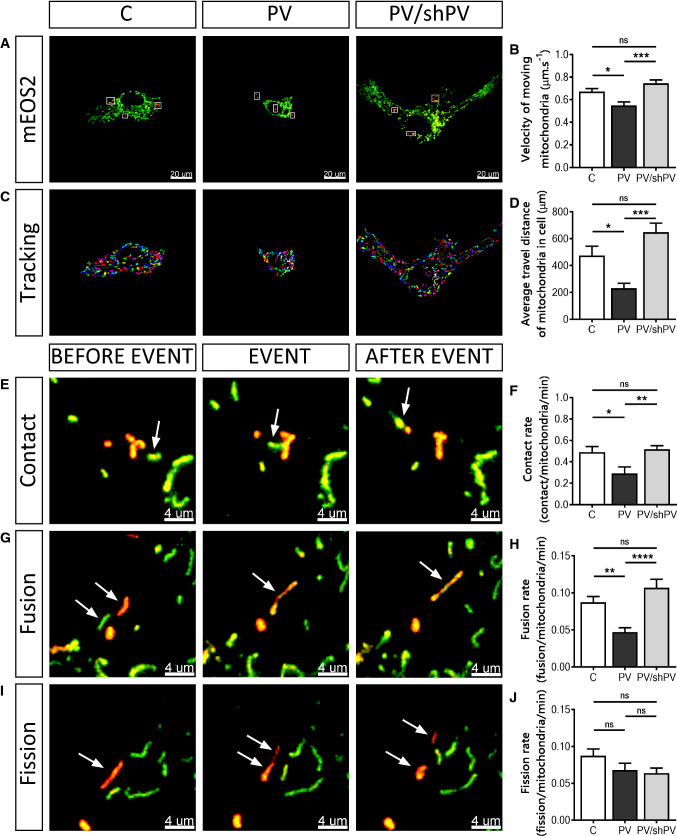
Parvalbumin decreases mitochondrial dynamics. a Representative images showing MDCK cells transfected with the mitochondria-targeted, photoconverted fluorescent protein mEOS2. Non-activated mitochondria are shown in green and activated (red) mitochondria are shown within white rectangles. All mitochondria were then tracked in Retrack software version 2.10.05. In this software, tracked mitochondria were marked by colors (one out of the seven colors) to easily follow movement of each mitochondrion. Trajectories were generated from entire xy-t-stacks shown in the overlap after subtraction of sequential images (c). Quantification of mitochondrial velocity (b) and measurements of distances that mitochondria travelled within a cell (d) are shown. Visualization of mitochondrial contacts (e), fusion (g) and fission (i) events. Mitochondria of interest are marked with white arrows to follow this event in time-lapse mode. Values for mitochondrial contact rates (f), fusion rates (h) and fission rates (j) during 10 min observation were normalized per activated mitochondria per minute

