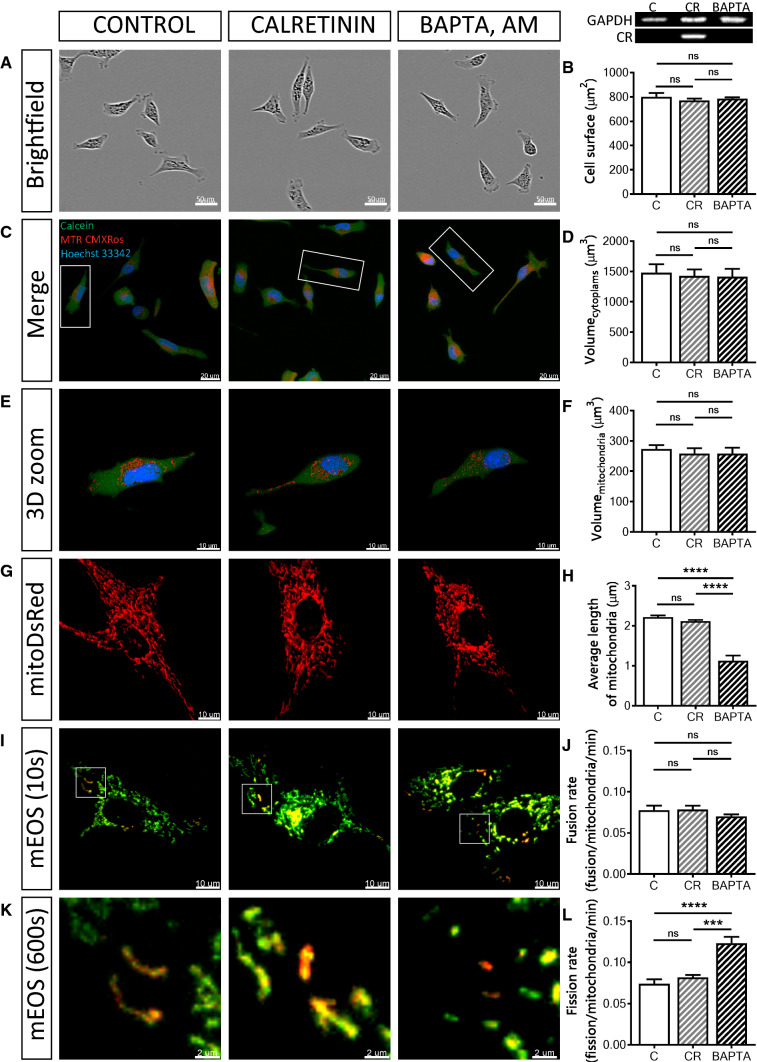
Fig. 6.
Overexpression of the Ca<Superscript>2+</Superscript> buffer/sensor protein calretinin, and loading of MDCK cells with the non-proteinaceous Ca<Superscript>2+</Superscript> chelator BAPTA. Control MDCK cells were compared to MDCK cells overexpressing calretinin (CR-MDCK) or C-MDCK loaded with 10 µM BAPTA-AM for 30 min (BAPTA). Representative images of MDCK cells acquired using the IncuCyte Live-Cell Imaging system (a). Quantification of the surface area of 100 cells in each group (b). Protein expression levels of CR in MDCK cell lines were determined also by Western blot analysis. For the normalization, GAPDH signals were used. Representative confocal images (c) showing the merged images of the cytoplasm (Calcein-AM), mitochondria (MitoTrackerTM Red CMXRos) and nuclei (Hoechst 33342). Selected representative cells (white rectangles) are shown in 3D view (e). Stereological analysis of 3D-reconstructed MDCK cells revealed that the volume of the cytoplasm (d) and volume of mitochondria (f) was unchanged. Mitochondrial length was measured using the mitochondria-targeted protein mitoDsRed (g, h). More than 30 cells were analyzed in each group. i Representative images showing MDCK cells transfected with the mitochondria-targeted, photoconverted fluorescent protein mEOS2, showing non-activated (green) mitochondria and activated (red) mitochondria. Selected regions (white rectangles) are shown at higher magnification at the end of the experiment (k). Estimation of mitochondrial fusion rates (j) and mitochondrial fission rates (l) were determined during a 10-min observation period and then normalized per activated mitochondria per minute

