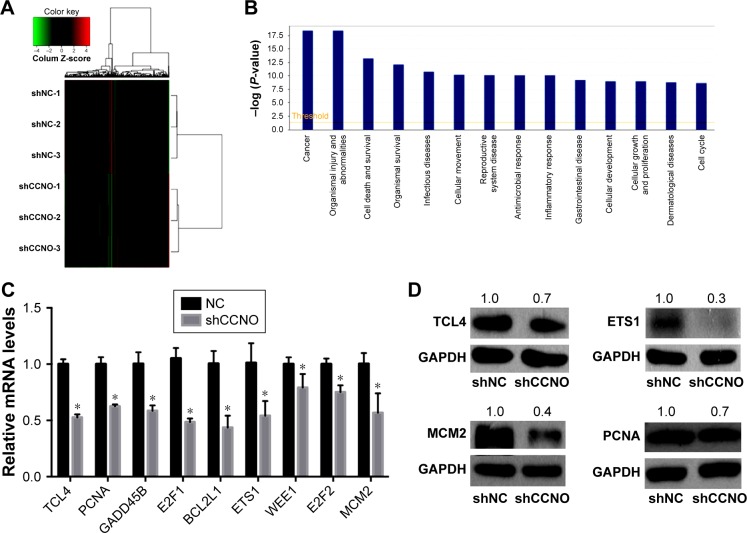
Figure 5.
Identification of gene expression profiling regulated by CCNO in human GC cells.
Notes: Microarray analysis was performed to compare gene expression in human GC cells infected with lentivirus-expressing shCCNO or NC control. (A) Heatmap representing the 652 upregulated genes and 527 downregulated genes in the shCCNO group compared with the control group. These differentially expressed genes involve a 1.5-fold change at least (P<0.05). A color scale for the normalized expression data is shown at the top of the microarray heatmap (green represents downregulated genes while red represents upregulated genes). (B) Disease and function analysis for the differentially expressed genes after CCNO silencing. (C) Confirmation of microarray results by RT-qPCR analysis in AGS cells. *P<0.05. (D) Confirmation of microarray results by Western blot analysis in AGS cells. GAPDH was used as the internal control. MCM2, ETS1, PCNA, and TCF4 protein expressions were decreased after infection with shCCNO.
Abbreviations: GC, gastric cancer; RT-qPCR, real-time quantitative polymerase chain reaction.

