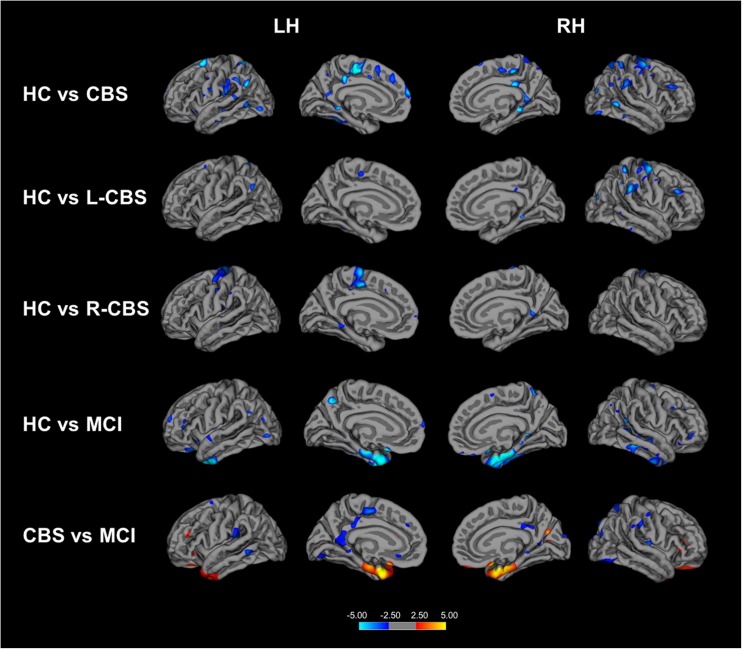
Fig. 4.
Volumetric changes in patients with corticobasal syndrome and mild cognitive impairment. Cortical areas showing decreased thickness in patients with CBS compared to healthy controls (top row); cortical thinning in CBS patients who present clinically with most affected left side (L-CBS; n = 8) (second row); and patients who present clinically with most affected right side (R-CBS; n = 3) (middle row). Cortical thinning in patients with MCI compared to healthy controls (fourth row). Cortical thickness in patients with MCI compared to CBS patients. Cortical thickness maps are displayed on average surface of FreeSurfer’s Qdec (Query, Design, Estimate and Contrast) interface. Colour bar indicated the Z scores. Results were obtained at P < 0.05 after multiple comparisons correction using Monte Carlo simulation. LH = Left Hemisphere; RH = Right Hemisphere; HC=Healthy Controls; CBS=Cortiobasal Syndrome; MCI = Mild Cognitive Impairment

