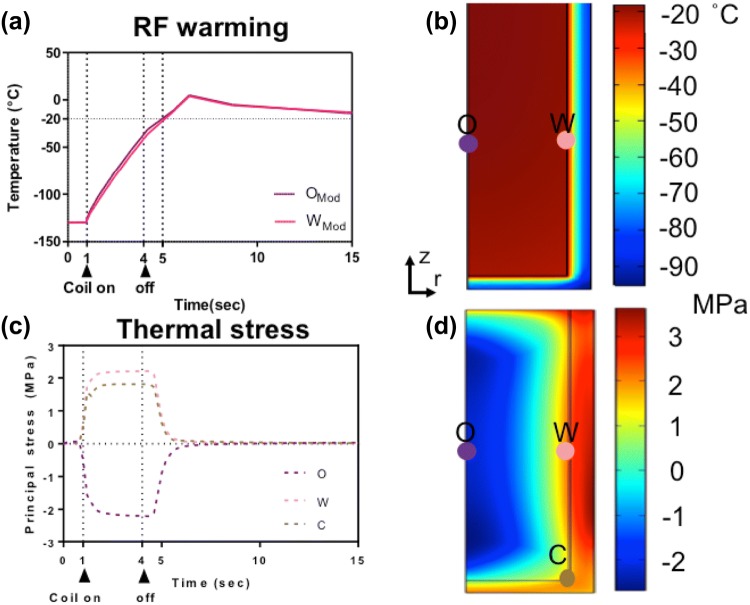
Figure 6.
Computational thermal and mechanical stress analysis during ultrarapid warming. The simulated thermal (a and b) and stress responses (c and d) to ultrarapid heating are shown. The positive values in (c) represent tension, while negative values imply compression in the system. Note that the vitrified system would fail at much lower tension than compression; therefore, failure may occur in areas where the positive stress is maximum (e.g., a wall) but still below the yield stress of 3.2 MPa34 (d).

