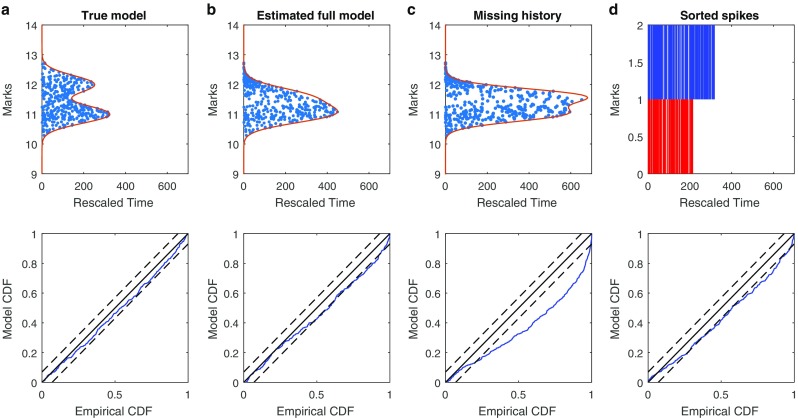
Fig. 2.

Goodness-of-fit analysis for simulated data based on candidate models: Leftmost panels (a) use the true model and parameter values that generated the data, including correct structure for place fields, marks, and history dependence; Middle-left panels (b) use the complete model with parameters estimated by maximum likelihood; Middle-right panels (c) use an estimated model that includes the correct structure for place fields and marks, but omits the history dependence; Rightmost panels (d) use an estimated model that includes correct structure for place fields and history dependence, but uses crude spike sorting rather than true mark structure. Top panels show rescaled spike times (blue dots) and observation intervals (red line) across all mark values. For spike sorted model, rescaled times for each cluster are shown. Bottom panels show KS plots based on all rescaled spike times. The true model produces rescaled spikes that are uniformly distributed in time-mark space with p-value= 0.37 for the Pearson chi-square test and a KS plot that stays within 95% confidence bands. The estimated true model produces rescaled spikes that are not uniformly distributed in time-mark space with p-value ≤ 10− 5 for the Pearson chi-square test and a KS plot that stays roughly within 95% confidence bands. The Pearson chi-square test for the model missing history dependence has a p-value < 10− 5, indicating non-uniformity of rescaled spikes. The two intensity models for the sorted spikes demonstrate lack of fit in the KS plots
