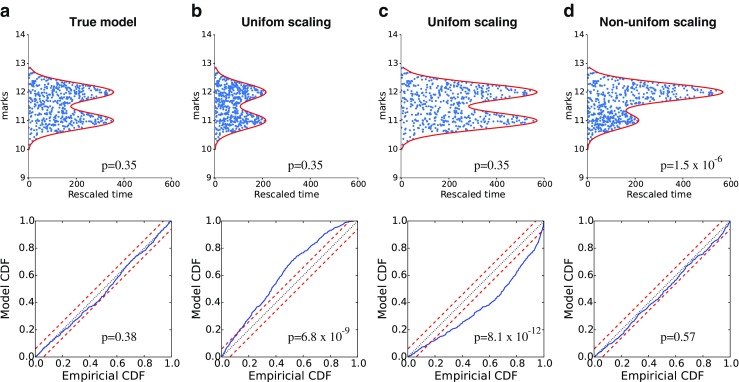
Fig. 3.

Goodness-of-fit analysis for simulated data based on four candidate models: The top panels show the rescaled spikes (blue) and region, R (red), and the p-values for the chi-square test; the lower panels show KS plots and corresponding p-values. The models are (left panel) true model, (next two panels) true model λ(xt, m) scaled uniformly by 0.56 and 1.6, and (right panel) true model whose components ac, c = 1,2 scaled separately by 0.56 and 1.6, respectively. The last model roughly preserves overall firing rate. KS plots detect the correctness of the firing rate irrespective of mark value, while the Pearson chi-square test characterizes how well the model captures mark structure of the joint mark intensity, which explains why the middle two wrong models still pass the Pearson chi-square test, while the last model passes the KS test
