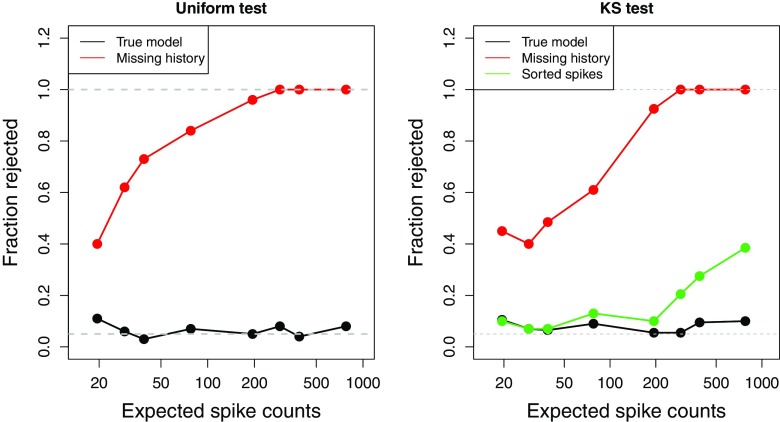
Fig. 4.
Power analysis: sample size effect Chi-square and KS test The effect of the expected spike count on the rejection rate of 100 realizations of the Pearson uniformity (left panel) and KS (right panel) tests for three different models, the true model (black line), the missing history model (red line), and the sorted spike model (blue line). The gray dotted lines indicate the significance level of 0.05 and the power = 1 value

