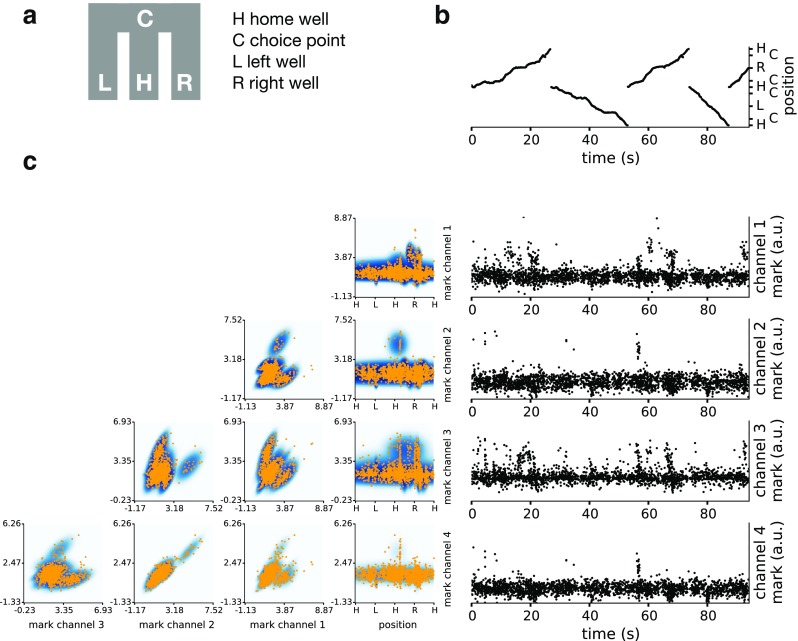
Fig. 5.

Unsorted spikes and their marks from rat CA3 as it traverses a W-shaped maze, and fitted mark intensity function: a Schematic of the maze. There are 4 landmarks, the home well H, the choice point C and the left L and right R reward wells. b Timing and location of all observed spikes in the 1-dimensional position representation. c Left, the fitted joint mark intensity function and spikes, shown in all combinations of 2-dimensional projections. Orange dots are spikes, and the darker color shows higher intensity. Right, timing and mark (spike amplitude) in each of the tetrode channels of observed spikes. The clustering of spikes in time is a consequence of place-specific firing
