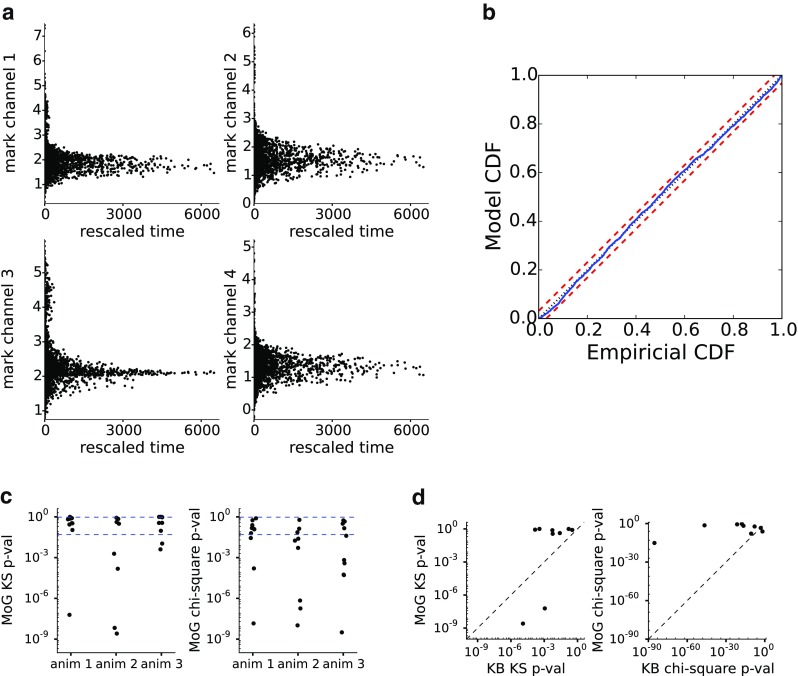
Fig. 6.

Rescaling analysis for unsorted spikes and their marks from rat CA3: a Time-rescaled spikes in each of the 4 tetrode channels. The same spikes appear in each of the 4 panels at the same rescaled time, but at different mark values. b The corresponding KS plot. The p-values for the KS test and Pearson chi-square test are = 0.81 and = 0.25, respectively. c Summary from 10 tetrodes each from 3 animals of p-values of the KS and Pearson chi-square tests (13/30 passed both with p-values > 0.05 for both tests) of the MoG fit of the CA1 or CA3 spiking activity. d A comparison of goodness of fit of MoG and KB models for the spiking activity. 3 tetrodes from each animal were chosen for MoG and KB goodness-of-fit comparison
