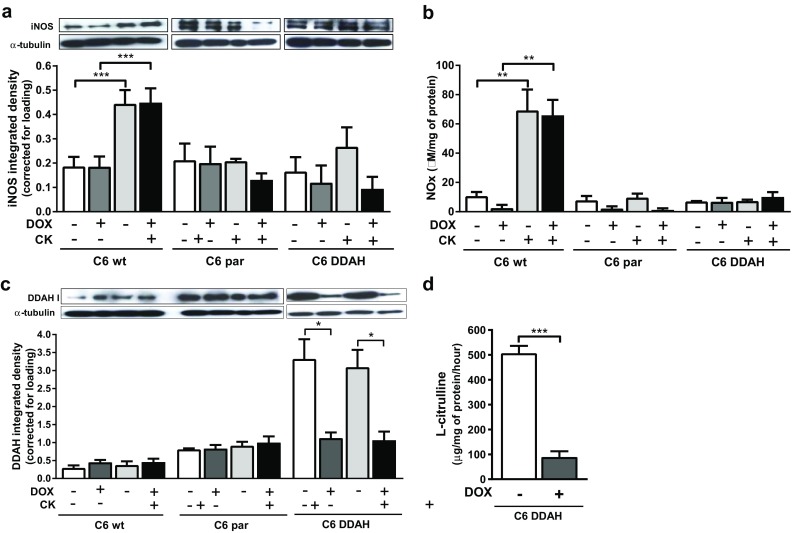
Fig. 1.

In vitro characterization of C6 DDAH cells in comparison with parental cells. Cells were treated for 4 days with 2 µg/ml DOX. For the last 48 h, cells were also stimulated with cytokines (10 ng/ml TNF-α, 1000 U/ml IFN-γ) and 5 µg/ml LPS. a iNOS (131 kDa) and c DDAH I (34 kDa) expression determined by western blot and integrated density of individual bands (corrected for loading). b NOx production. d l-citrulline production evaluated after 4-h incubation with ADMA substrate. Results are mean + 1 SEM of three separate experiments (*P < 0.05, **P < 0.01, ***P < 0.001)
