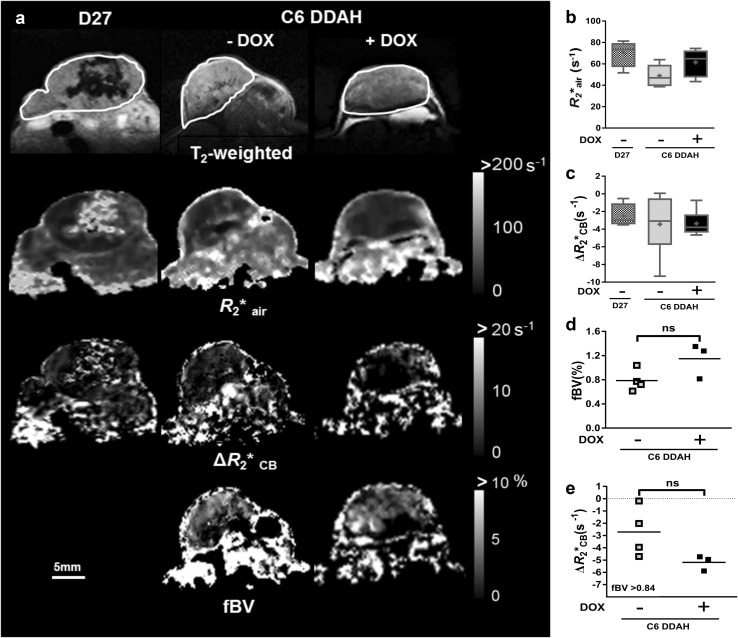
Fig. 4.
The effects of DDAH I up-regulation on tumour vascular development as determined by MRI of C6 DDAH xenografts (group A). a Representative T2-weighted images, parametric maps of baseline R2*air, ΔR2*CB in response to carbogen and fractional blood volume (fBV) acquired from the central tumour slice. ROIs encompassing the whole tumour volume are demarcated on the T2-weighted images. Box plot distributions of the median R2*air (b) and ΔR2*CB (c) values measured over the whole tumour volume of D27 (n = 4) and C6 DDAH ± DOX (n = 6) xenografts. Median fBV values (d) and median ΔR2*CB values (e) in regions where fBV is higher than the median fBV value of all the data of C6 DDAH − DOX (n = 4) and C6 DDAH + DOX (n = 3) tumours

