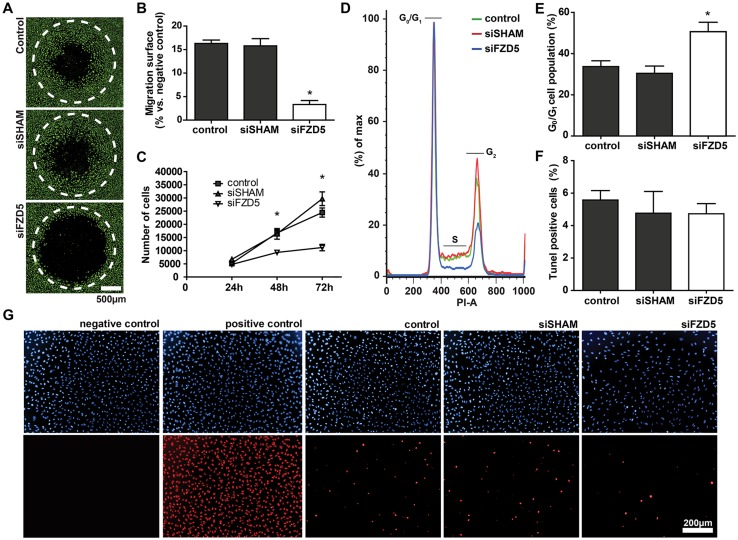
Fig. 3.
Endothelial knockdown of Fzd5 significantly inhibited EC migration and proliferation, but had no effect on apoptosis. a Representative fluorescent microscope images of Calcein-AM-labeled HUVECs (green) in a plug-stopper-based migration assay. Shown are the results of 16 h of migration of non-transfected control, siSHAM, and siFzd5 conditions. Scale bar represents 500 µm. Open migration areas produced by the plug-stopper before initiation of the assay are indicated by dotted lines. b Bar graph shows the quantified results of migration assay. Shown are the percentages of surface area within the dotted circle covered by HUVECs after 16 h of migration. N = 4, *P < 0.05 compared to control and siSHAM condition. c ECs expansion at 24, 48, and 72 h post seeding in similar densities, as quantified by flow cytometry. N = 3, *P < 0.05 compared to control and siSHAM condition (two-way ANOVA followed by Bonferroni post hoc test). d Representative histogram of flow cytometric analysis of PI-based DNA staining showing the distribution of cells over the cell cycle in the different groups at 48 h post-transfection. e Quantified results of cell cycle analysis. Percentage of cells in G0/G1 phase is shown. N = 3, *P < 0.05 compared to control and siSHAM condition. f Quantified results of TUNEL staining. Percentage TUNEL-positive cells of total number of cell is shown, 72 h post-transfection of control, siSHAM, and siFzd5 conditions. N = 3, no significance. g Representative fluorescent microscope images of DAPI-based nuclei staining in HUVECs (blue, upper row) and TUNEL staining of the same cells (red, lower row). Positive control was treated with DNAse solution. Scale bar represents 200 µm

