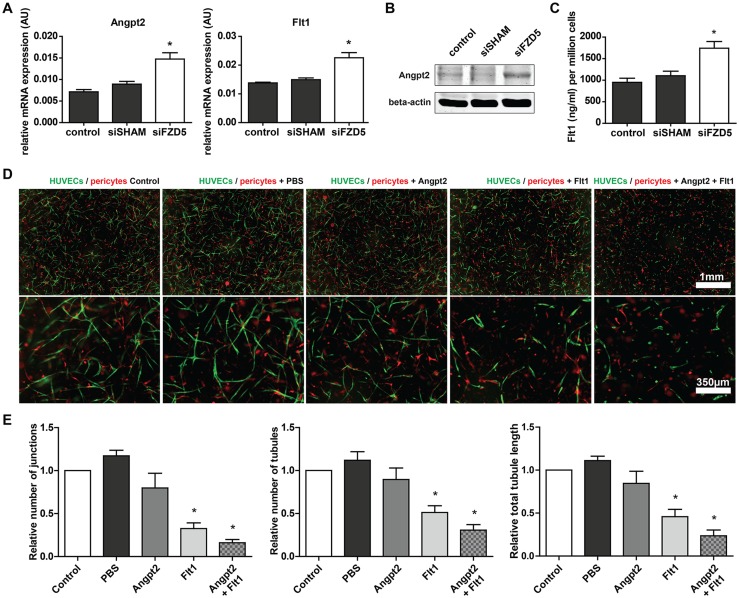
Fig. 5.
Fzd5 knockdown led to increased expression of vascular regression-associated genes Flt1 and Angpt2. a QPCR results of expression levels of Angpt2 and Flt1 in different conditions 72 h post-transfection. N = 11, *P < 0.05 compared to control and siSHAM condition. b Representative Western blot results of Angpt2 expression levels in the different conditions 72 h post-transfection. N = 3. c Enzyme-linked immunosorbent assay-based quantification of secreted Flt1 levels in cultured endothelial medium 72 h post-transfection. N = 8, *P < 0.05 compared to control and siSHAM condition. d Representative fluorescent microscope images of GFP-labeled HUVECs (green) in co-culture with dsRED-labeled pericytes (red) in a 3D collagen matrix during vascular formation. Shown are the results at day 5 of an untreated control, and after stimulation with PBS, Angpt2 (1000 ng/ml), Flt1 (1000 ng/ml), and Angpt2 + Flt1 (1000 ng/ml both). Scale bar in the upper row represent 1 mm, in the bottom row 350 µm. e Bar graphs show the quantified results of the co-culture assay. Shown are the total tubule length, and the number of endothelial junctions and tubules after 5 days. N = 4, *P < 0.05 compared to control and siSHAM condition

