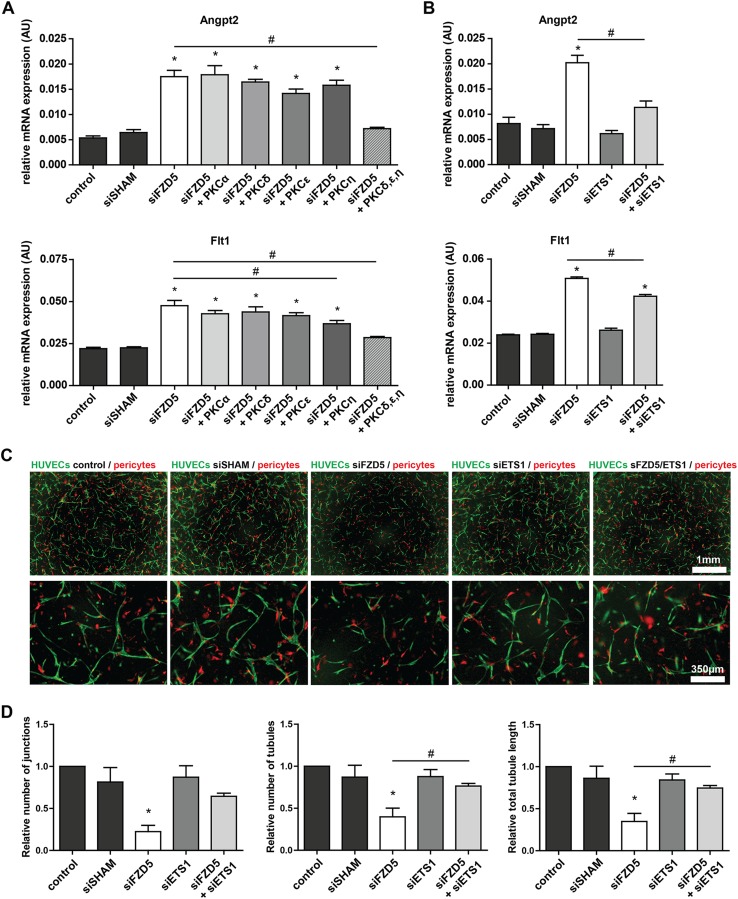
Fig. 7.
Fzd5 knockdown-induced upregulation of Angpt2 and Flt1 expression is mediated via enhanced PKC and Ets1 signaling. a QPCR results showing expression levels of Angpt2 and Flt1 in HUVECs after knockdown of Fzd5 alone, in combination with knockdown of different PKC isoforms, and in combination with knockdown of all novel PKC isoforms (PKCδ,ε,η), 48 h post-transfection. N = 4, *P < 0.05 compared to control and siSHAM condition, #P < 0.05 as indicated in graph. b QPCR results of Angpt2 and Flt1 expression in HUVECs, 72 h post-transfection, with and without knockdown of transcription factor Ets1, a downstream target of PKC. N = 4, *P < 0.05 compared to control and siSHAM condition, #P < 0.05 as indicated in graph. c Representative fluorescent microscope images of GFP-labeled HUVECs (green) in co-culture with dsRED-labeled pericytes (red) in a 3D collagen matrix during vascular formation. Shown are the results at day 5 of non-transfected control, siSHAM, siFzd5, siEts1 and the combined knockdown of Fzd5 and Ets1. Scale bar in the upper row represents 1 mm, in the bottom row 350 µm. d Bar graphs show the quantified results of the co-culture assay. Shown are the total tubule length, and the number of endothelial junctions and tubules after 5 days. N = 6, *P < 0.05 compared to control and siSHAM condition, #P < 0.05 as indicated in graph

