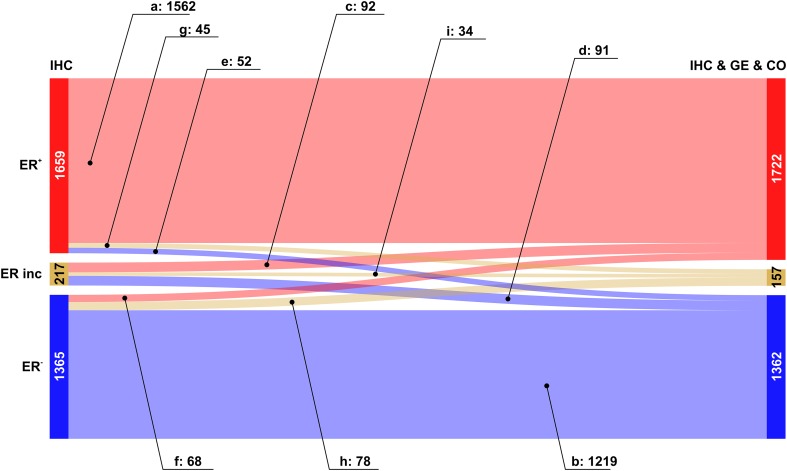
Fig. 2.
Overall improvement of estrogen receptor assessment. Colour code for categories of receptor assessment: red: receptor positive (+), beige: receptor status inconclusive, blue: receptor negative (−). Note that the category ‘inconclusive’ for IHC in fact means that the IHC estimate is missing. Left sidebar of Sankey diagram: number of patients classified on basis of ‘IHC only’ (red: ER+, beige: ERinc, blue: ER−). Right sidebar of Sankey diagram: number of patients classified when considering joint information from IHC, expression of the receptor gene GE, (ESR1) and the co-gene, CO, (AGR3). Flows from left (‘IHC only’) to right (IHC & GE & CO) are coloured according to their final category. Numbers of patients are given together with labels of flows (a–i)

