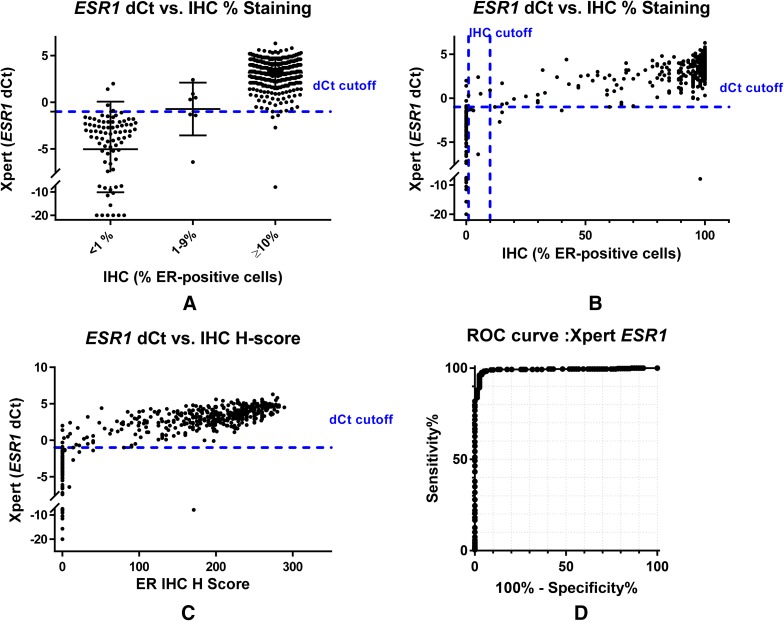
Fig. 1.
Comparison of estrogen receptor status determined by immunohistochemistry and RT-qPCR (STRAT4 or [STRAT4 (Xpert)]) assays. a Graph of STRAT4 ESR1 dCt values by ER IHC result categorized as negative (0%), low positive (1–9%), or positive (≥ 10%). Among ER-positive and ER-negative breast cancers according to IHC assessment, there is also a clear separation by ESR1 mRNA by RT-qPCR into high and low expression subgroups. In contrast, those breast cancers with from 1 to 9% ER-positive carcinoma cells have predominantly ESR1 mRNA quantities near the RT-qPCR cut-off separating “positive” from “negative”. b Comparison of STRAT4 ESR1 dCt values according to ER IHC % staining alone. The plot of ER IHC percentage positive tumor cell immunohistochemical staining demonstrated a strong correlation with ESR1 mRNA quantity. c Graph of STRAT4 ESR1 dCt values by ER IHC H-Score. H-Score is defined as [3(% of tumor staining 3+)] + [2(% of tumor staining 2+)] + [1(% of tumor staining 1+)]. Quantitative stratification of the IHC protein assessment by combining percentage of immunostained tumor cells with intensity of immunohistochemical staining demonstrated an improved correlation with ESR1 mRNA determined by RT-qPCR. d The ROC curve for STRAT4 ESR1 including all samples in the analysis. The area under the curve (AUC) is 0.99

