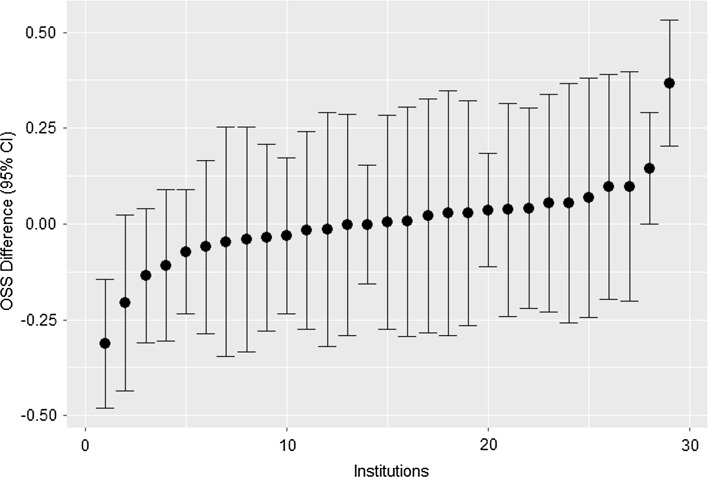
Fig. 2.
Inter-institution differences in average ordinal stigmatization score (OSS) in the 29 institutions included in the analytic sample. Mean OSS for each institution (in increasing order) is given by a single point, while the vertical bars around each point denote a 95% confidence interval for that institution. All values are with reference to—that is, centred about—the mean OSS for all institutions

