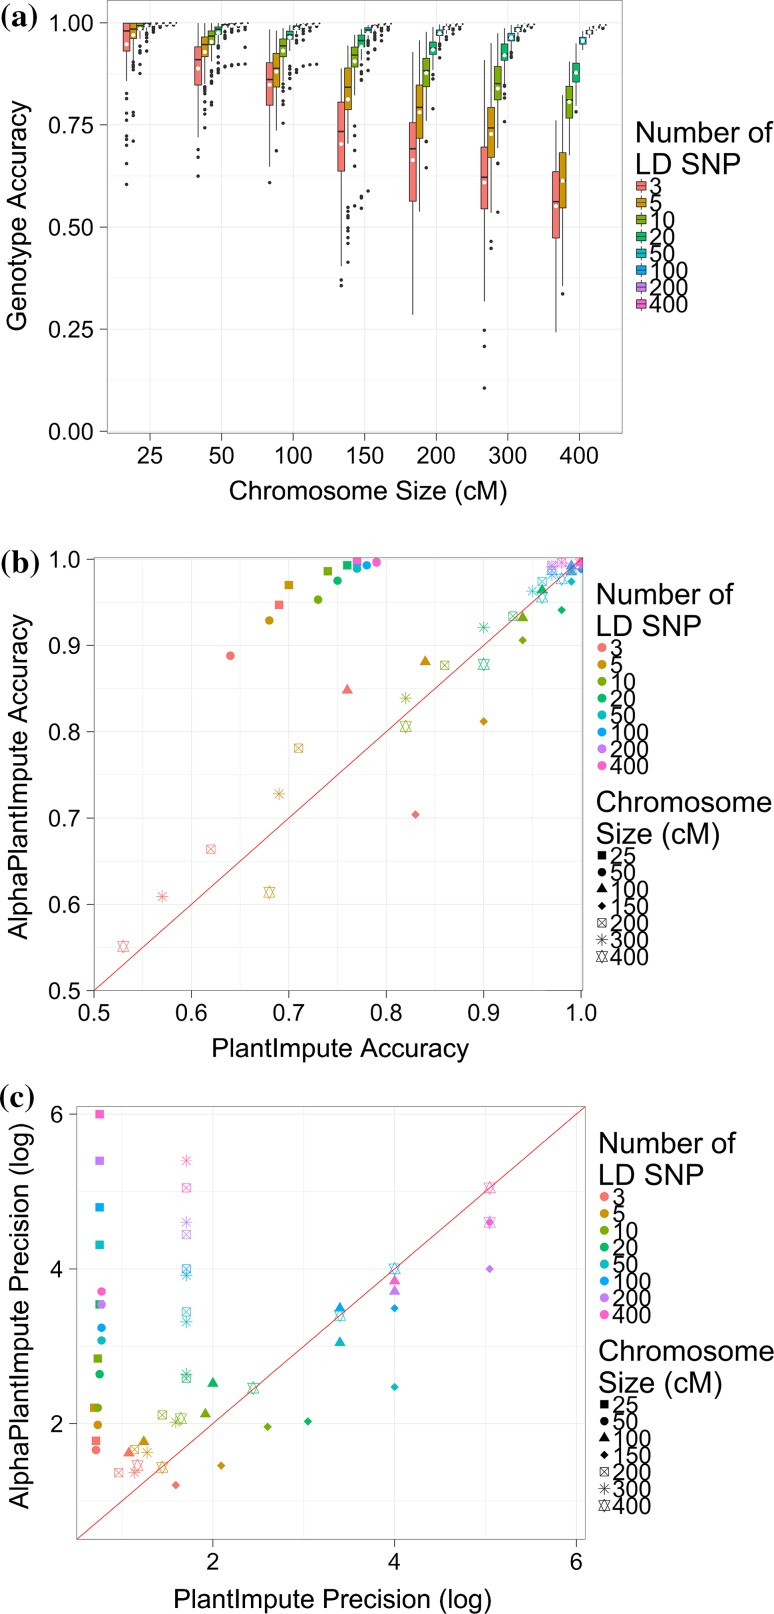
Fig. 5.
Effect of chromosome size. a The genotype imputation accuracy using AlphaPlantImpute in F2 focal individuals from a bi-parental cross of F20 parents against seven chromosome sizes of 25, 50, 100, 150, 200, 300, and 400 cM. b Comparison of the average genotype imputation accuracy using AlphaPlantImpute (y-axis) versus using PlantImpute (x-axis). The colours represent the different LD arrays. The shapes represent the chromosome size. The red diagonal line indicates when the accuracy of PlantImpute equals AlphaPlantImpute. Points above the line are when imputation accuracy is higher with AlphaPlantImpute and points below the line are when imputation accuracy is higher with PlantImpute. c Comparison of the precision in imputation accuracy using AlphaPlantImpute (y-axis) versus using PlantImpute (x-axis). The colours represent the different LD arrays. The shapes represent the chromosome size. The red diagonal line indicates when precision of PlantImpute equals AlphaPlantImpute. Points above the line indicate when the precision in accuracies is higher in AlphaPlantImpute and points below the line are when the precision in accuracies is higher in PlantImpute

