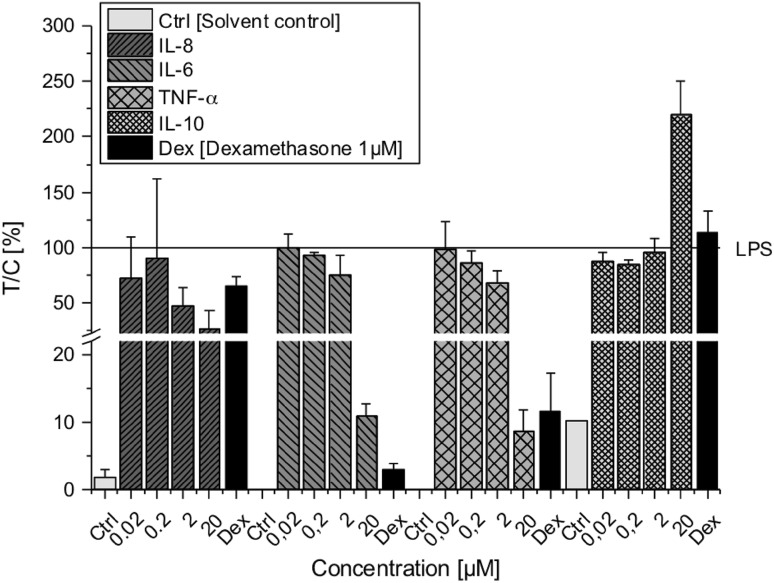
Fig. 4.
Cytokine secretion levels of IL-8, IL-6, TNF-α and IL-10 in LPS-stimulated THP-1 derived macrophages after AOH exposure measured with ProcartaPlex™ Multiplex Immunoassay. THP-1 macrophages were preincubated with AOH for 2 h followed by an 18 h LPS challenge (10 ng/ml). Cytokine protein levels were calculated as percent of treated cells over control cells (treated with LPS) × 100 (T/C, %) and are expressed as mean ± SD of T/C (%) normalized to LPS. Statistical significances between varying concentrations of AOH were evaluated by Kruskal–Wallis ANOVA and significances compared LPS were calculated by Mann–Whitney U test; n = 3 independent experiments

