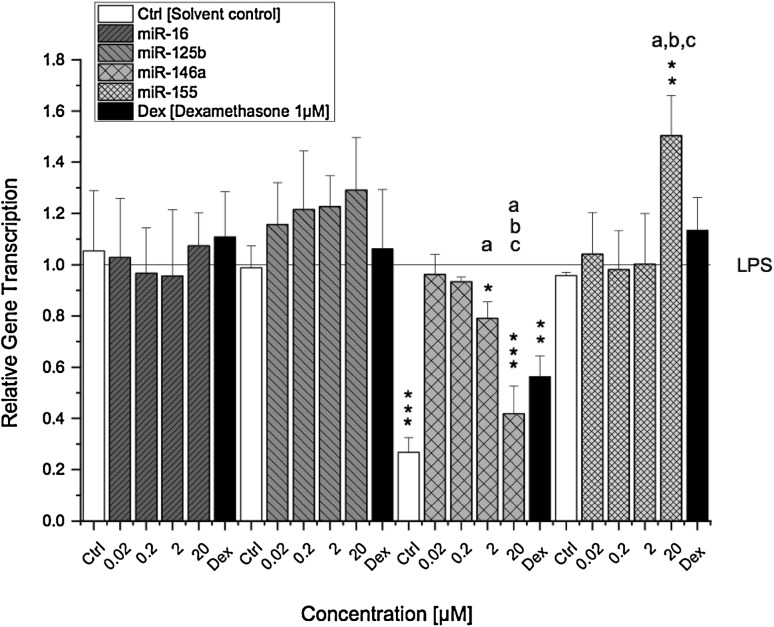
Fig. 5.
Transcription levels of miR-16, -125b, -146a and -155 in LPS-stimulated THP-1 derived macrophages after AOH exposure. THP-1 macrophages were preincubated with AOH for 2 h followed by an 18 h LPS challenge (10 ng/ml). Relative transcript levels were measured with qPCR. Results are expressed as mean ± SD of the relative gene transcription () normalized to LPS-stimulated macrophages. Statistical significances between varying concentrations of AOH were evaluated by one-way ANOVA and Holm–Bonferroni test (a–c p < 0.001) and significances compared to LPS were calculated with a two-sample t test (*p; **p; ***p < 0.05, 0.01, 0.001); n = 3–5 independent experiments

