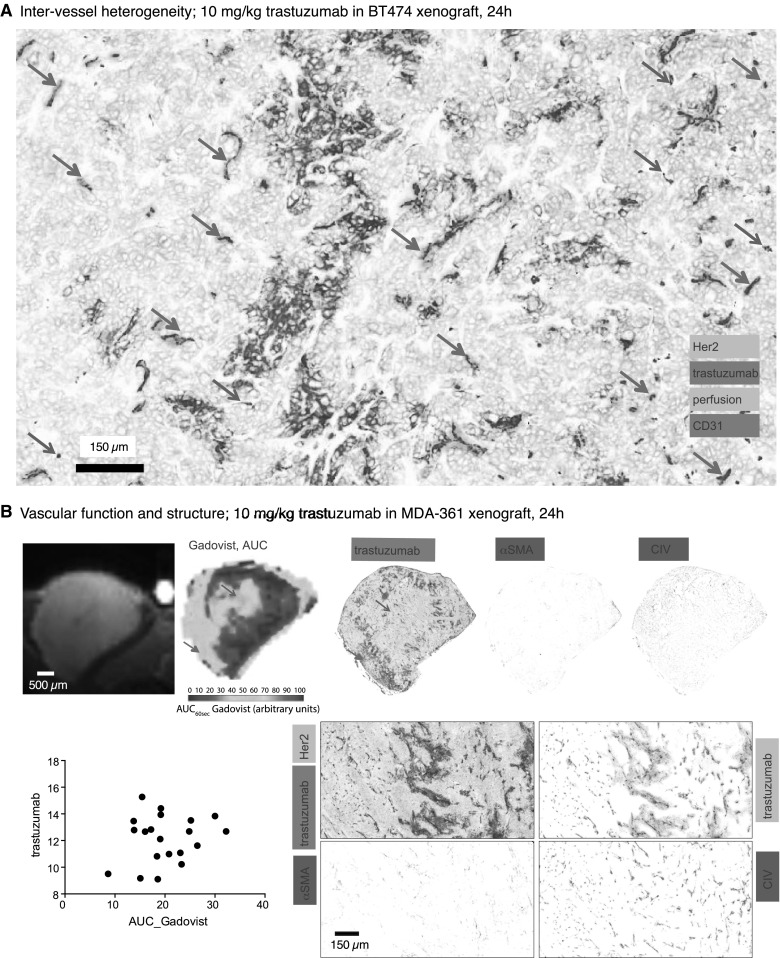
Fig. 4.

Distribution of Tz in vivo relative to tumor blood vessels. a Magnified region of a BT474 xenograft grown orthotopically in inguinal mammary fat pad and treated with 10 mg/kg trastuzumab for 24 h. Trastuzumab extravasates from vessels heterogeneously, with many patent vessels showing no extravascular bound trastuzumab (green arrows) even when adjacent to other patent vessels that do have perivascular trastuzumab. Carbocyanine fluorescent dye (cyan) around CD31 stained vessels (blue) indicates patency; non-patent vessels are indicated (red arrows). b DCE-MR imaging of Gadovist accumulation (GadovistAUC60) in MDA-MB-361 tumors is compared with detailed histology mapping of matched histological sections. Regions with greatest AUC60(Gadovist), reflecting greatest vascular function, do not consistently correspond to areas of greater trastuzumab distribution (red arrow); this is also demonstrated quantitatively where matched slices were plotted for amount of bound trastuzumab and AUC60(Gadovist). The same sections were stained for vascular architectural markers αSMA and CIV (both shown in red), neither of which exhibit a pattern of distribution similar to the presence or absence of trastuzumab (whole sections top; zoomed in region below). (Color figure online)
