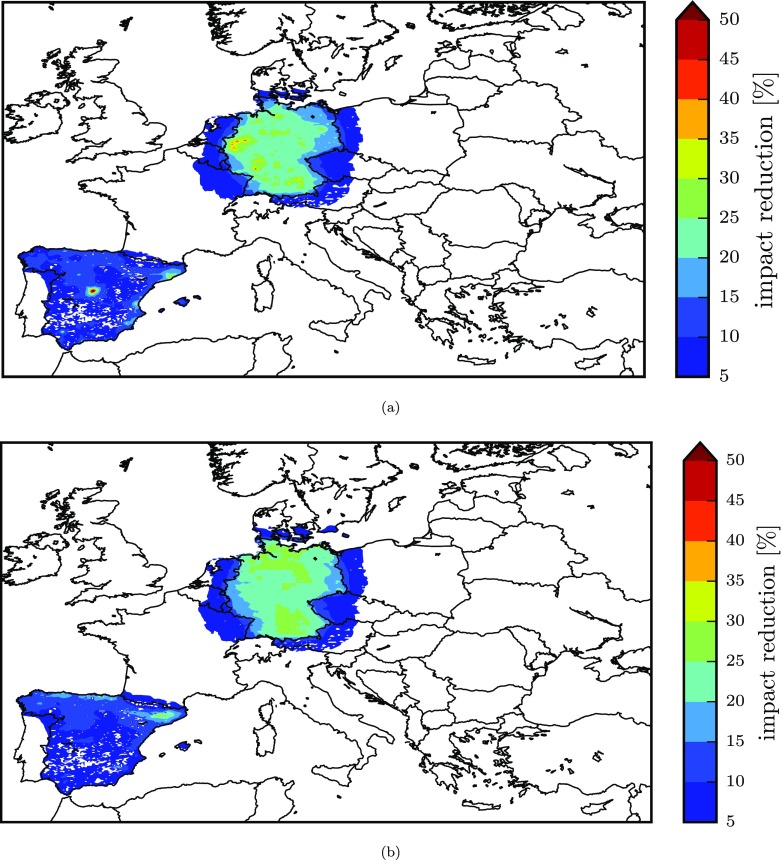
Fig. 9.
Gridded impact on exposure to PM2.5 for sectoral reductions in Germany and Spain, corresponding to the results of Fig. 8. Impacts resulting from the prioritisation of sectors for decreasing values of potency ηp,s are reported in a for increasing ones are reported in b

