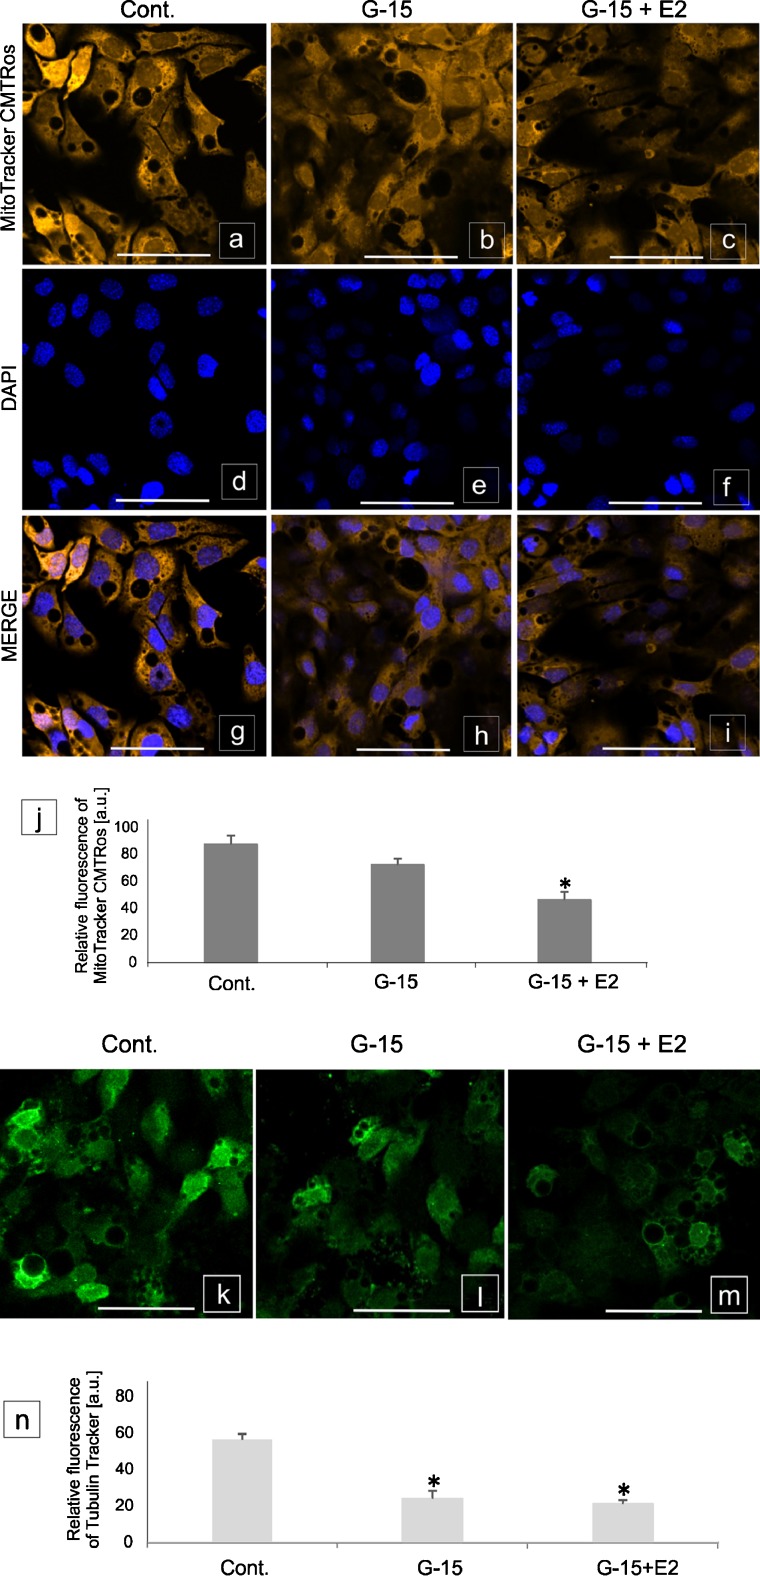
Fig. 6.
Effect of GPER blockage on Leydig cell mitochondrial activity and cytoskeleton structure. Representative microphotographs and graphs of (a–j) mitochondrial activity and (k–n) cytoskeleton structure in control, G-15- and E2- treated MA-10 Leydig cells. Representative microphotographs of cellular localization of MitoTracker (a–i) in cytoplasm of control (a, g), G-15 (b, h) and G-15 with E2 (17β-estradiol) (c, i)-treated Leydig cells. Immunofluorescence with DAPI (d–f). Representative microphotographs of cellular localization of TubulinTracker in cytoplasm of control (k), G-15 (l) and G-15 with E2 (m)-treated Leydig cells. Fluorescence without DAPI. Scale bars represent 20 μm. Samples of cultured Leydig cells were measured in triplicate. Quantitative analysis of fluorescence of MitoTracker (j) and TubulinTracker (n). Histograms of fluorescent intensities expressed as relative fluorescence (arbitrary units; a.u.). Data are expressed as means ± SD. Asterisks show significant differences between control and G-15 (50 μg/kg bw) - treated mouse testes and control and G-15 (10 nM), E2 (10 nM) - treated cells for 24 h. Values are denoted as * p < 0.05

