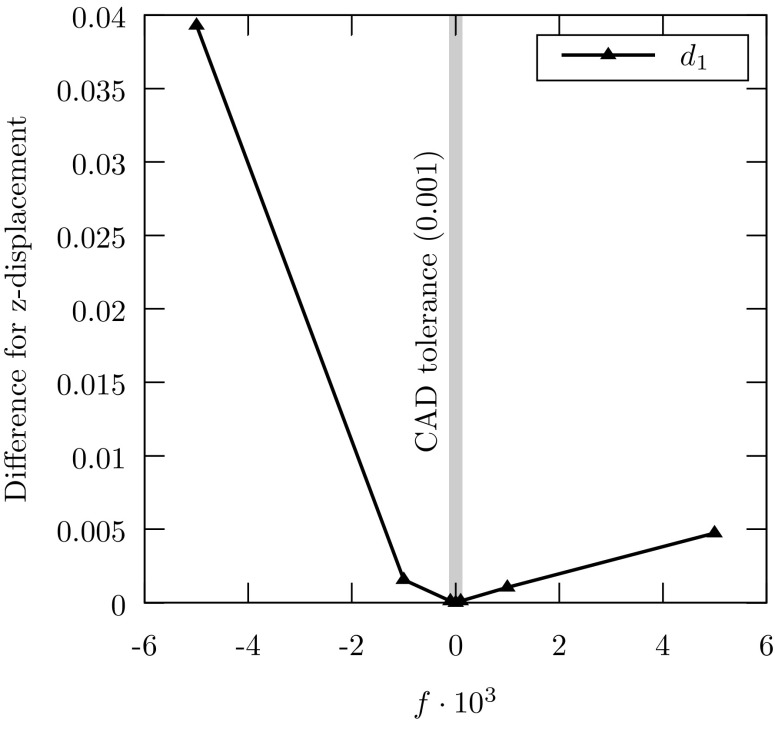
Fig. 60.
Comparison of the relative vertical displacement related to the gap–overlap parameter f. Gaps and overlaps are indicated by positive and negative values, respectively. The gray area of the diagram indicates the default tolerance of the CAD software used. (Courtesy of Breitenberger [37, 38])

