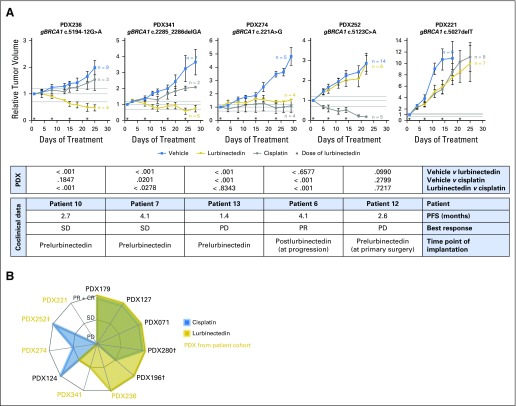
Fig A5.
Antitumor activity of lurbinectedin and cisplatin in vivo. (A) Plots depict the change in tumor volume upon treatment with vehicle, lurbinectedin, or cisplatin in five patient-derived xenograft (PDX) models from patients in arm A. Dotted lines represent the boundaries of disease progression (PD; > 20%) and partial response (PR; < 30%), being stable disease (SD) in between. The number of tumors per group also are shown. Error bars are SEM. The table lists statistical comparisons among treated PDX groups (P value is shown), and coclinical information of the patient of each PDX. (B) Radar plot of the response to lurbinectedin and cisplatin in 11 PDX models derived from patients with germline BRCA1/2 mutations and either breast or ovarian cancer, including the five PDXs shown in (A). Filled area represents sensitivity to the drugs (ie, SD, PR, CR, PD). PDX from patients in arm A are shown in gold. PDX252 was derived from patient 6 at progression to lurbinectedin (note that the resulting PDX recapitulated resistance to lurbinectedin). (†) PDX from BRCA1-mutated ovarian cancer. (‡) PDX obtained at lurbinectedin progression.

