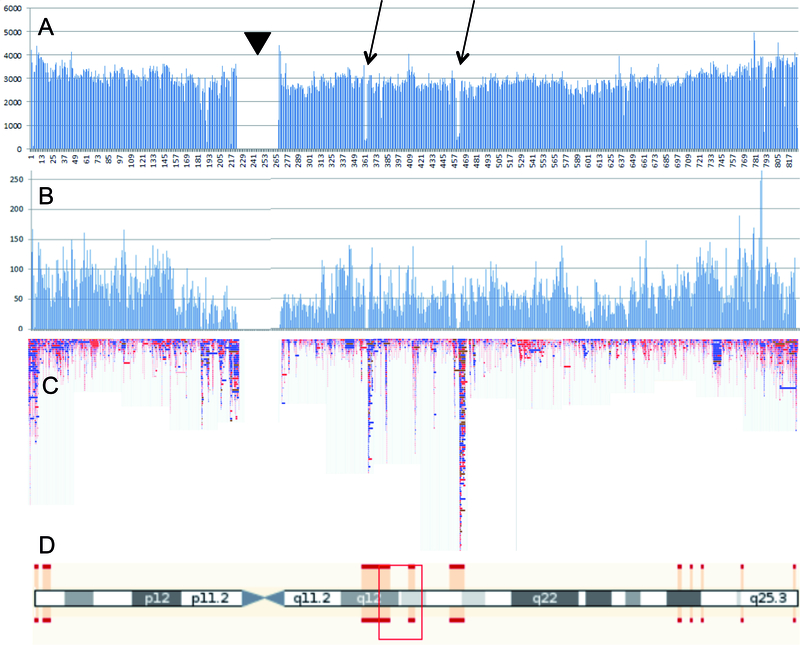
Figure 2. CNV detection using SNP-microarrays.
Fig. 2A. All annotated short variants from dbSNP (https://www.ncbi.nlm.nih.gov/SNP/), distributed over 100 Kb bins along chromosome 17; Fig. 2B: all SNPs from chromosome 17 of the Illumina Omni 5 exome platform; Fig 2C. All CNVs of human chromosome 17 from the Database of Genomic Variants (DGV: http://dgv.tcag.ca/dgv/app/home); Fig. 2D. Idiogram of chromosome 17. Red bars delineate regions of uncertain mapping due to segmental duplications. Arrows point to regions with low SNP density in dbSNP. The low SNP-density is not outbalanced by SNP selection for the Illumina platform. Regions with low SNP density on the Illumina array appear to be very rich in CNV. Arrowhead indicates peri-centromeric region.

