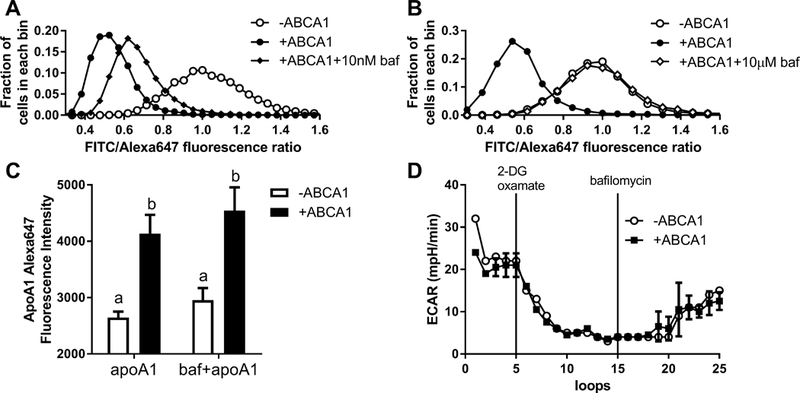
Figure 4. Inhibition V-ATPase by bafilomycin A1 inhibits apoA1 acidification.

ABCA1 induced and non-induced BHK cells were pretreated +/− 10 nM (A) or 10 μM (B) bafilomycin A1 for 1 hr. Cells were then incubated with 1 μg/ml FITC/Alexa647 apoA1 for 45 min at 37oC +/− bafilomycin A1 followed by flow cytometry to measure the FITC/Alexa647 ratio as indication of apoA1 acidification. Plot shows the frequency histogram of FITC/Alexa647 ratio; representative of 3 independent experiments. C. FITC/Alexa647 labeled apoA1 uptake by BHK cells with or without ABCA1 induction was not inhibited by treatment with 10 μM bafilomycin A1 for 1 hr, as assessed by Alexa647 flow cytometry (N=3, mean ± SD, different letters above the bars show P<0.05 by ANOVA posttest). D. ABCA1 induced and non-induced BHK cells extracellular acidification rate (ECAR) in the medium was measured by Seahorse in a time course for 25 loops (9 min/loop). 2-deoxyglucose and oxamate were injected at the loop 5 to inhibit the lactic acid production by glycolysis. At loop 15, 10 μM bafilomycin A1 was injected to cells to inhibit V-ATPase (N=3; mean ± SD; representative of ≥ 3 independent experiments).
