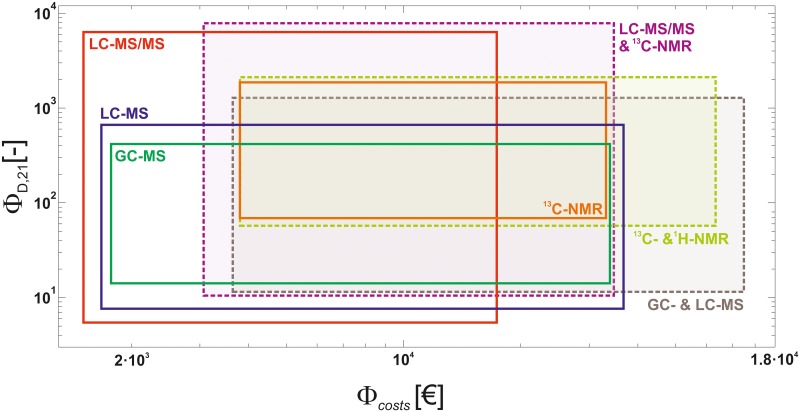
Fig 6. Ranges of Pareto-optimal D-criterion values ΦD,21 versus costs ΦCosts of the 3D-MO-ED problem for different analytical platforms and platform combinations filtered for solutions with full model dimensionality (p = 21).
Pareto frontiers connect lower left and upper right corners of the boxes (see also the Pareto fronts in Fig 7). Axes are log scaled. See supplementary information for results for p < 21 (S4 Text).

