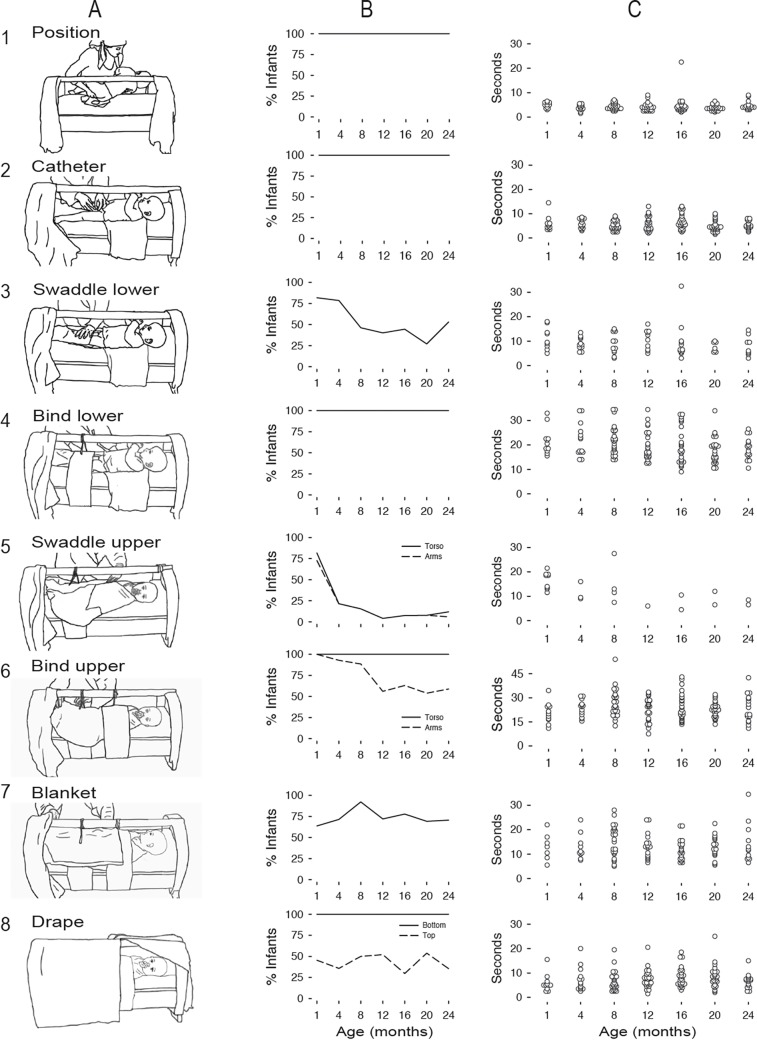
Fig 3. Quantitative description of the cradling process.
(A) We identified 8 sequential steps. (B) Percentage of dyads displaying each step across age. Solid lines show steps that were universal across dyads; dashed lines show steps that only some mothers displayed. (C) Duration (in seconds) of each step for each dyad across infant age groups. Symbols denote individual data from each dyad.

