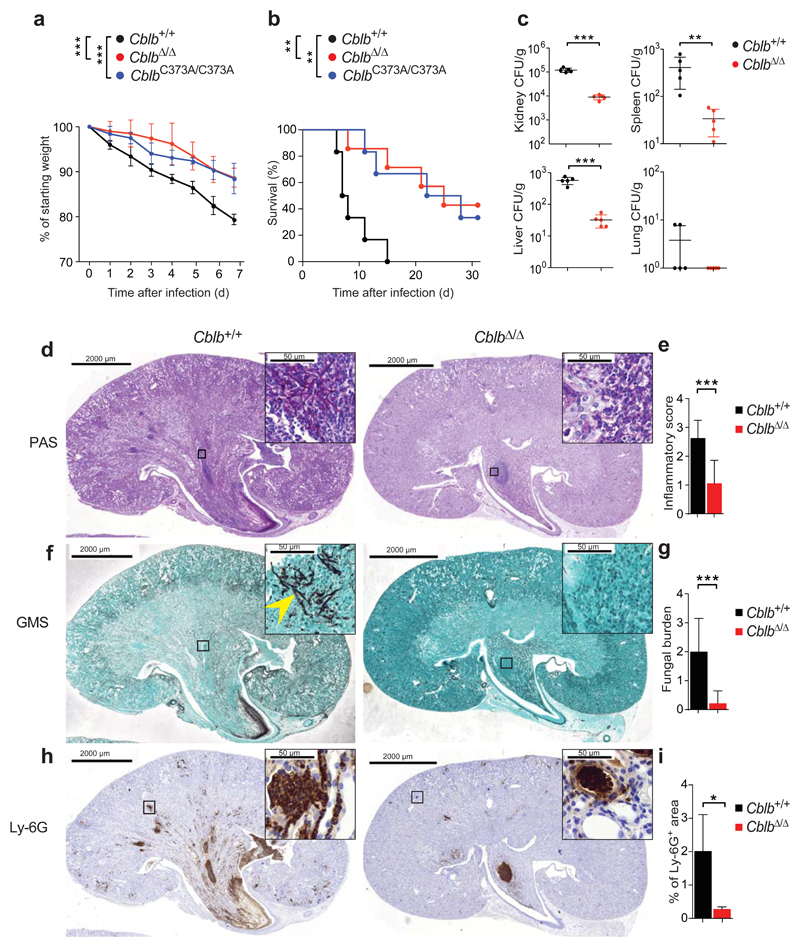
Figure 1. Cblb regulates anti-fungal immunity.
(a,b) Cblb+/+, CblbΔ/Δ, and CblbC373A/C373A mice were infected intravenously with C. albicans (105 CFU/21.5 g body weight) and monitored over time. Plots depict (a) weight loss as compared to starting weight (P values assessed by two-way ANOVA) or (b) survival after infection (P values assessed with log rank test). n = 6 for Cblb+/+ and CblbC373A/C373A, n = 7 for CblbΔ/Δ mice. (c) C. albicans fungal load in organs 7 days after infection. Dots represents individual mice. (d,e) Periodic-acid-Schiff (PAS) stained kidney sections 7 days after systemic C. albicans infection (d). (e) Combined inflammatory score based on renal immune cell infiltration/inflammation, and tissue destruction. (f,g) GMS stained kidney sections from mice 7 days after C. albicans infection (f). Arrowhead indicates fungal hyphae. (g) Fungal load scored by analysis of GMS stained sections. (h,i) Ly-6G stained kidney sections 7 days after C. albicans infection (h). (i) Plot depicts percentage of kidney area scored as Ly-6G positive. Insets in (d,f,h) show boxed areas at increased magnification. Panels (d-g) n = 4 for Cblb+/+, n = 5 for CblbΔ/Δ mice; panels (h,i) n = 4 for Cblb+/+, n = 4 for CblbΔ/Δ mice; panels (d-i) 4 sections/kidney analyzed. For panels (c,e,g,i) data shown as means ± standard deviation. For panels (a,b) 1 representative of 6, for panel (c-i) 1 representative of 3 independent repeats is shown. *P < 0.05, **P < 0.01, ***P < 0.001 as calculated with Student’s t-test, unless stated otherwise.

