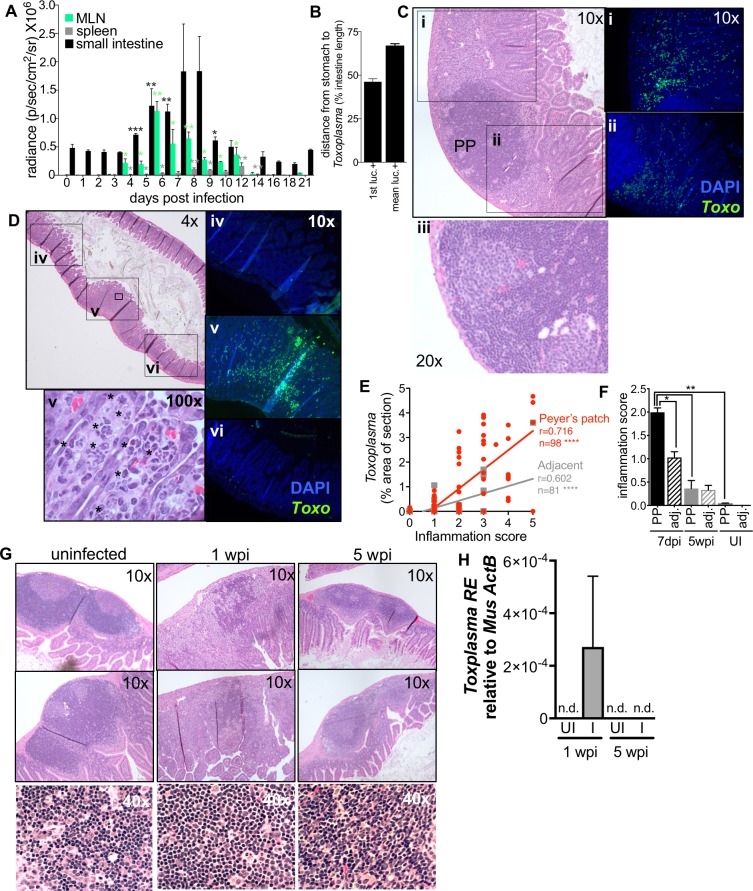
Fig 2. Mice recover from severe acute inflammation and parasite growth in the small intestine.
A-B, Following per oral infection with 200 Me49-GFP-luc cysts, mice were euthanized and parasite load was determined by BLI in the small intestine (black), mesenteric lymph nodes (MLN, green) and spleen (grey). N = 3 animals per day, Significance is measured for each time point relative to day 3 post infection. Student’s T-test * p≤0.01, ** p≤0.001. B, For each intestine, the position of the luciferase signal was measured as distance from the stomach to the first luciferase positive region (1st luc+) or distance from the stomach to the mean of all luciferase positive regions (mean luc +). The position of luciferase signal was averaged from 4 to 10 dpi. C-H, 2cm segments of the distal jejunum/ileum (the distal 50–90% of the small intestine) were excised for histology based on the presence of Peyer’s patches visible to the eye at 7dpi, 5wpi or from uninfected mice. C-D, Representative images of 7dpi sections stained with H&E to assess inflammations score at 10x or 20x (iii) magnification (scale of 1 = no detectable inflammation to 5 = complete disruption of lymphoid structure and/or villi). Parasites vacuoles were visible in the villi at 100x magnification (v, asterisks). In addition to staining a section for H&E, an adjacent section of each intestinal segment was stained with a Toxoplasma-specific antibody (green) and DAPI (blue) and imaged at 10x (i-vi) to assess parasite load. E, Correlation between parasite load and inflammation score in intestinal segments 7dpi. Segments containing a Peyer’s patch (red) or adjacent segments lacking a Peyer’s patch (grey), Pearson’s correlation **** p≤0.0001. Slopes were significantly different between the two groups: Peyer’s patch 0.781±0.078, adjacent 0.296±0.044 p<0.0001, linear regression of correlations. F, Inflammation score for Peyer’s patch-containing segments (solid bars) and adjacent, Peyer’s patch negative segments (dashed bars) of the intestine from uninfected animals, 7 dpi (black) or 5wpi (grey). Student’s T-test *p≤0.05, ** p≤0.001, SEM, N = 4–6 segments from 3 mice per condition. G, Representative images of Peyer’s patch organization in uninfected, 1wpi and 5 wpi small intestines. H, Parasite load in the Peyer’s patch containing intestine segments 1wpi or 5wpi using quantitative PCR. Toxoplasma RE expression relative to host actB. N = 5.

