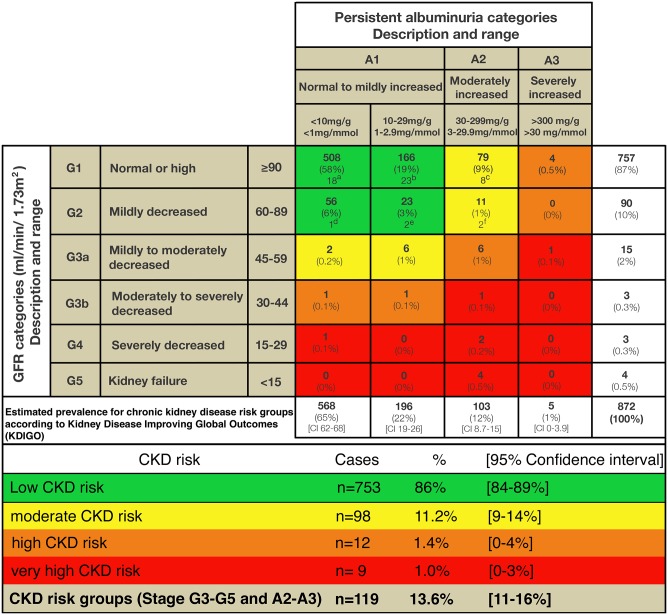
Fig 2. Distribution of patients based on eGFR and albuminuria with prevalence estimates according KDIGO chronic kidney disease risk groups [28].
Green: low CKD risk; yellow: moderate CKD risk; orange: high CKD risk; red: very-high CKD risk. a-f Subset of patients with evidence of systemic acute infection/inflammation or urinary tract infection (UTI) excluded from prevalence calculation (n = 54; 1/55 with acute infection/inflammation not shown due to missing ACR). ACR: albumin-creatinine-ratio; eGFR: estimated glomerular filtration rate; CKD: chronic kidney disease; KDIGO: Kidney disease improving global outcomes.

